Last year my good friend Gino Caballero and I we were asked to implement a methodology for violence prevention in San Salvador in urban communities downtown. Although we had previous experiences with mapping at Reacción, these had more to do with natural disasters[1] and done in communities where doing guided tours of the area was an easier possibility. This new experience involved areas that were not so accessible by walking, nor safe to walk during the times of the night when the workshops took place.
A second consideration to be made was that social variables are mostly perceptions, and these can vary very much among different groups of people even within the same community. But then again, we thought, aren't these mapping activities somewhat subjective anyway?
These approaches to the problem made us think of a new way to create and discuss maps. After a long discussion, we thought of creating games for people to play while gathering information.

What we were aiming for
The methodology that we developed was aimed to collect as much information as possible in a very short period of time. At the time we developed the idea we had the aggravating problem of not knowing the participants well, so we had to be careful about how the information was collected and how they reacted to the questions being asked. We had to worry about thinking: are we asking compromising things? Will people be willing to answer our questions? Will they become wary of our questions?
From a methodological perspective, we also wanted to develop a game that could be for community mapping aimed at solving different problems. The characteristics that we decided upon were the following: easy to understand and play, highly customizable to other mapping needs, and a game that would genuinely make people to enjoy instead of feeling like a survey.
Methodology
The game that Gino and I came up with was inspired to some degree by StreetScore[2], a neat initiative developed at MIT's Media Lab that aimed to use AI to measure the human perception of street photos. However, wanted to automate the evaluation process as little as possible by focusing on a more hands-on process that would bring insights from the community through discussion. Our second inspiration was Cards Against Humanity (CAH)[3], a game loved and hated by myriads of people (in some cases, loved in secret but too ashamed to admit it).
The beauty of CAH is its simplicity and the simple use of randomization and creativity to use surprise as a comical element in the game, while the rest of the dynamics are simply meant to keep the game in movement. We wanted to factor randomization and humor alike, while at the same time generating data points specific to certain points in the map that could be weighed and analyzed.
Preparation
In order to play the game, we took into account the following:
- Location selection: these had to be easily identifiable by all participants. In our case, we played by using known buildings and landmarks in the community, but we believe that a nice way to play it would be touring the community and determining which locations to use in a collective manner, in order to have participants remember them and spatially recall them while playing the game.
- Selection of categories and scenarios: these are related to the types of hazards that the game aims to measure, such as those caused by natural and environmental disasters, social risks, or any others that we may come up with.
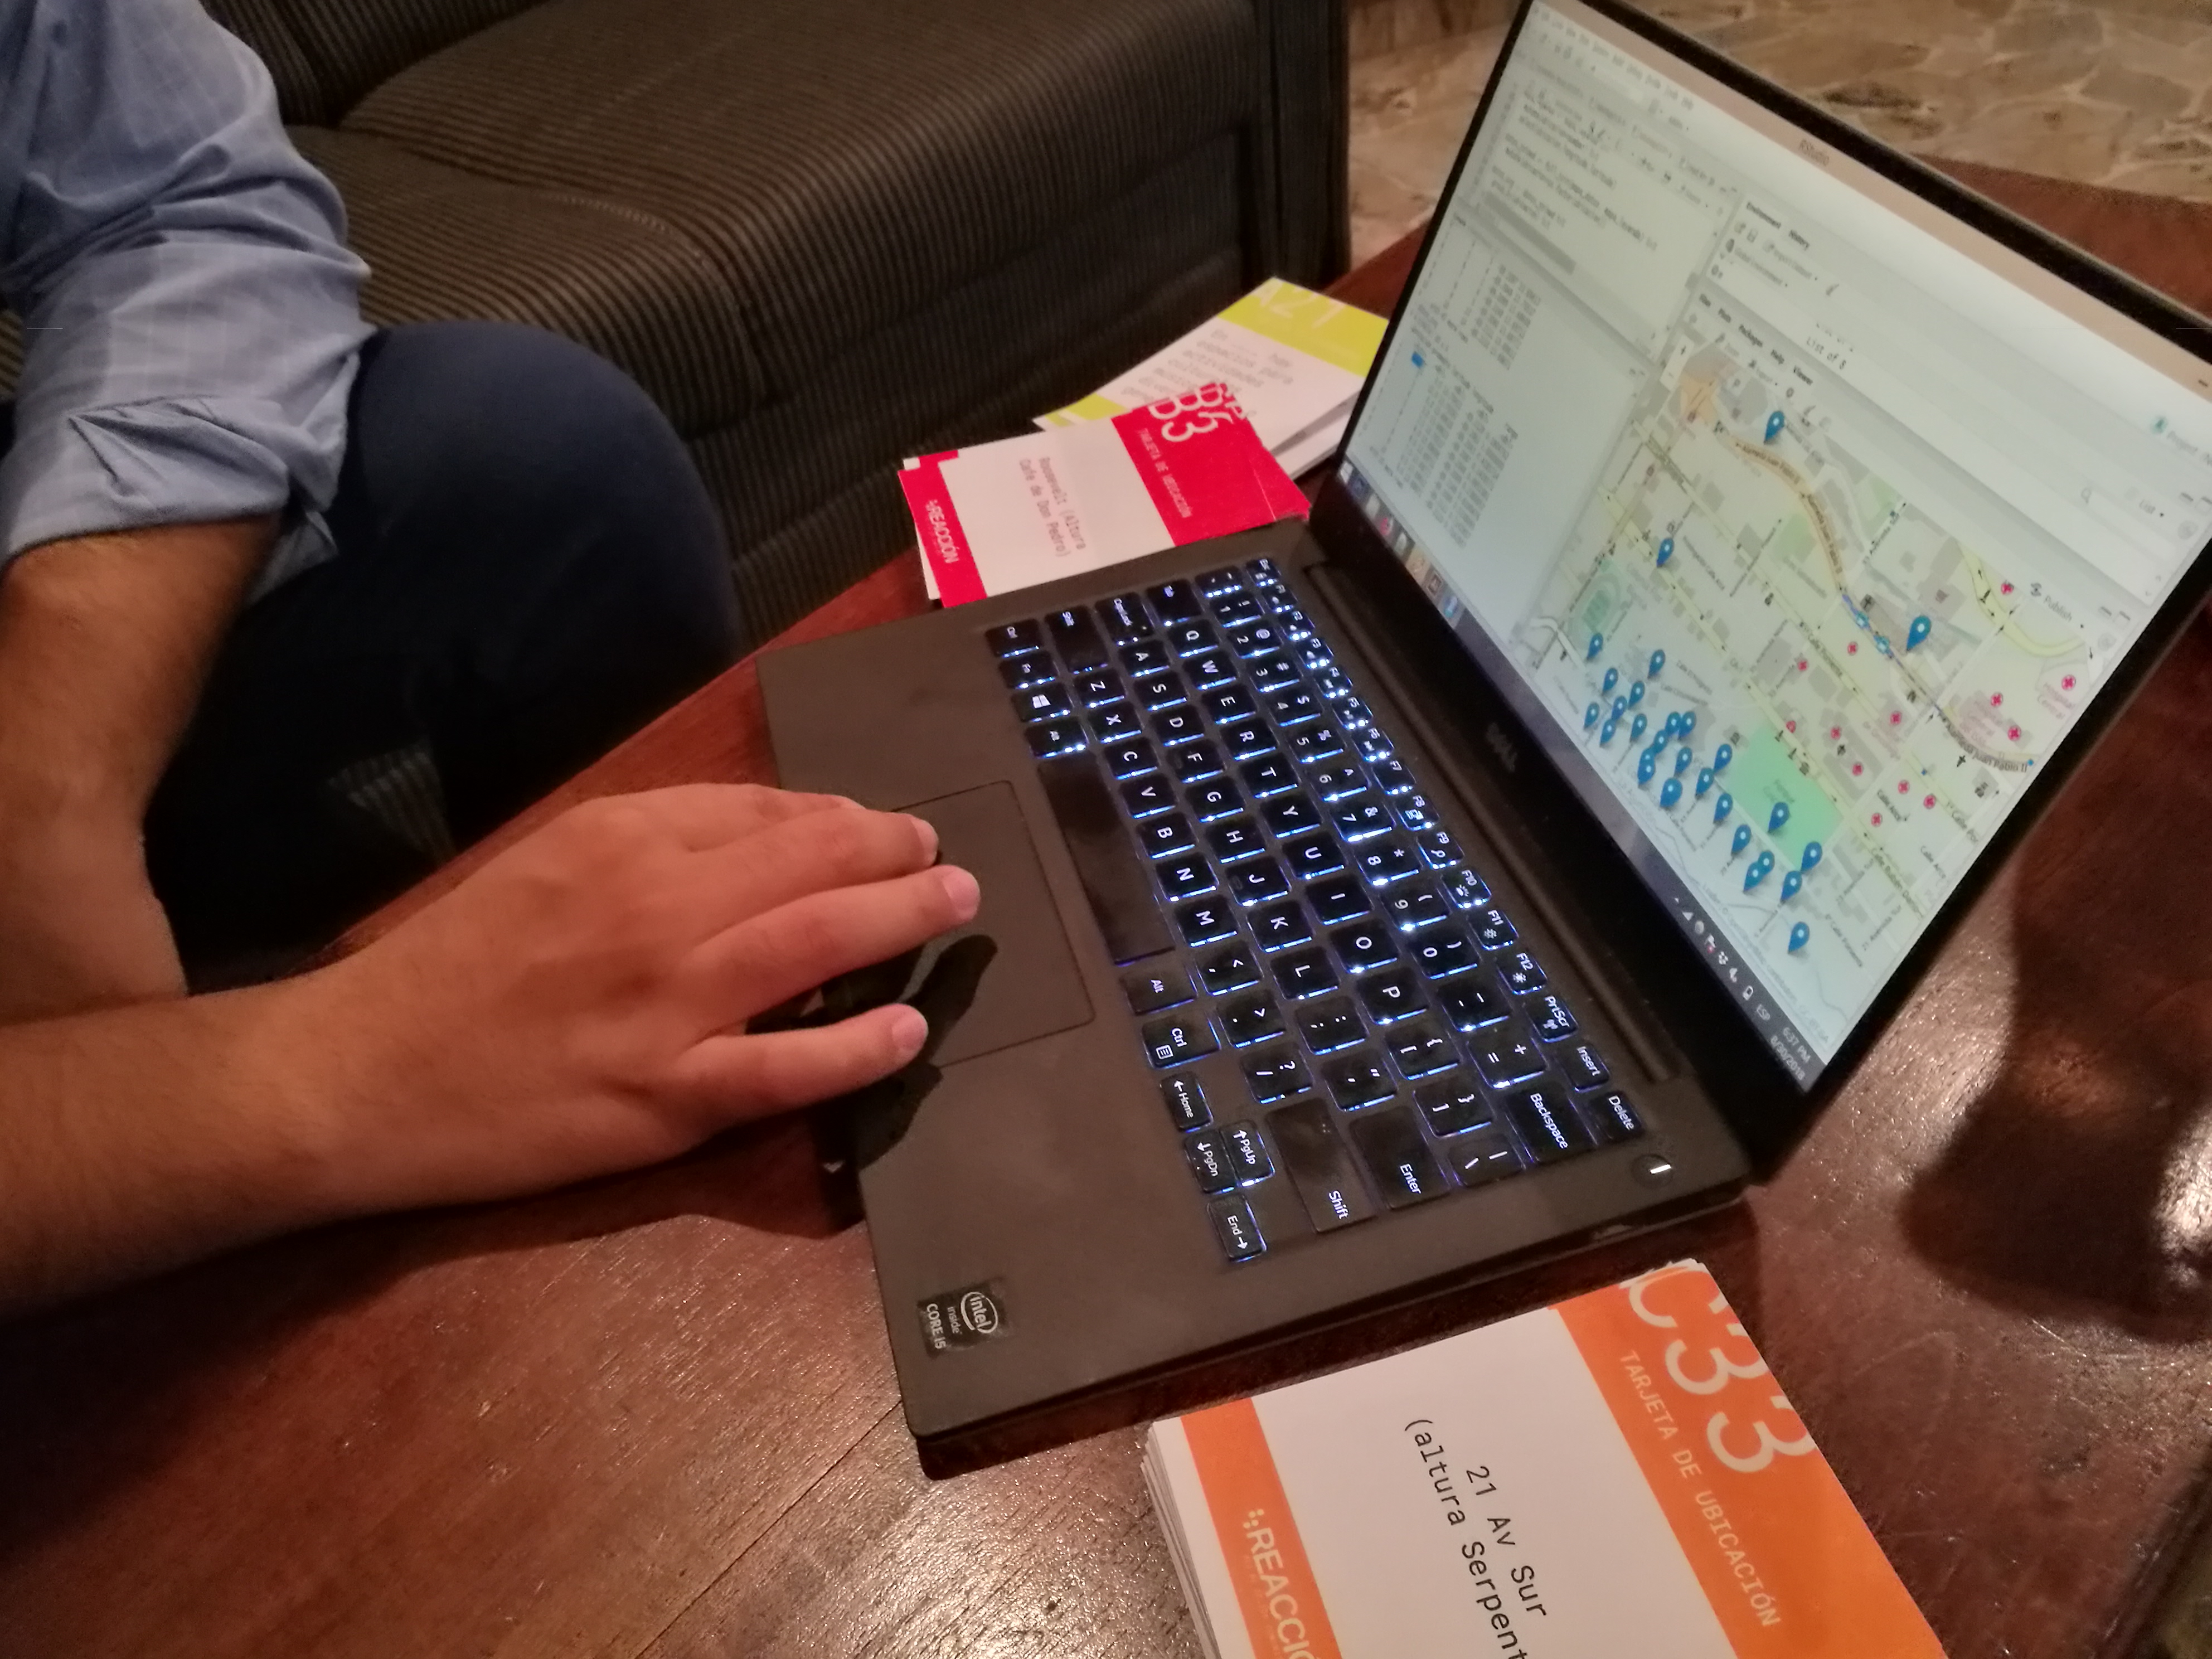
- Preparing the card game: this involves making two decks of cards, one for the locations and a second for the scenarios. For our game which was played for about ten people, we used around 20 scenarios and 30 locations. We think that a mathematical approach to maximize data taking would be useful to determine what is best.
- Working the procedure for data collection: a data sheet must be used, either on paper or digitally. We found easier to have a person doing it with pen and paper, and then inputting all the data in a spreadsheet immediately after each round.
- Preparing a mapping script: for this I used R and a few packages including
leaflet,leaflet.extrasandwebshot(to make html maps using Open Street Maps).
How to play
The process for playing the game goes as follows:
- One participant is selected as moderator. The moderator will draw the cards, read them out loud and count responses from participants.
- The moderator draws two cards are from two stacks: locations and scenarios, to form different sentences, à la Cards Against Humanity. For example: "I think that when I walk through ___ I can breathe clean air". If any questions arise, they are answered before responding.
- Participants will answer based on whether they agree or not with the randomly generated sentence. In our case, we did this by raising a flag or a card, because it allowed for non-literate persons to be part of the process. Although recording responses digitally may be easier, we found that there are different dynamics when people discuss their responses, especially those that are outliers, for example by asking: are the persons who responded differently part of a privileged group (based on gender, minority group, socioeconomic status)? Do these persons have different approaches to the question, or did they misunderstand the question? These are all valuable and will not be necessarily recorded on the data sheet.
- Either the moderator, an automatized method or another person will record the responses from the questions and feed a data sheet.
- A round ends with one of the stacks running out of cards. Cards can be shuffled and other rounds can be played. In our case, we put other activities in between during the workshop that helped clarify some concepts that can help the participants' evaluation abilities.
- A map is generated based on the score resulting from the participants' responses by using the script.
- The map is finally shown to the group to discuss.
Data visualization
A few ideas came up in the process of creating the maps for visualizing the results for participants to discuss at the end of the workshop. The idea for these isn't to have a scientifically verifiable map, but an easy way to observe which areas are most affected according to the chosen categories. We considered two types of map: "heatmaps" (which are technically clusterized visualizations according to the location's weighed score) and isometric data visualizations. We felt that a heatmap is easier to understand. Some of the questions that we discussed with the group were:
- What are the biggest points in the map?
- What is happening at these locations? What are the causes for the problems?
- How do these problems affect your daily routine? Do you go through them or avoid them?
- How can we measure the variables shown in the map? Have you ever used sensors or seen them?
What we found out
The game can be completely played online or through a card deck as we did. The advantage of using a physical game is that it doesn't seem as menacing as other approaches might, especially for older people. For example, we held a workshop with this game for women over 60 years old without any problems.
Another interesting thing that we saw is how games can be a good way to socialize and reflect on information. Whether an area is safe, clean or secure isn't probably a question that a person has done to themselves in their daily lives unless time is spent in reflecting about it, so doing it in a way that doesn't involve a screen or a keyboard, but rather a community discussion is a good starting point for teaching regular citizens about the importance of these issues. For example, the result from this intervention were used to validate and modify some of the police rounds that were planned in the city. About four hours of workshops gathered data to validate a USD 200K study!
Finally, I personally think that game design has a great potential for gathering information regarding perceptions. From this experience, we want to continue validating this tool to create an open card game kit to use as a preamble to citizen science and disaster response.
1. https://reaccion.net/reaccion-in-pasto-colombia/
2. http://streetscore.media.mit.edu/
3. https://cardsagainsthumanity.com/
0 Comments
Login to comment.