Washington Square Park, New York City
Mapped by Oscar Brett, Oscar Brett - Breto314@newschool.edu
Cartographer: Stewart Long
Published by gonzoearth
40.730882728896034 N, -73.99735756456181 E
506 views
Ground resolution: 1.4 cm/px
Capture date: 2011-04-27T00:00:00
Publication date: 2011-06-03T00:00:00
License: Public Domain
Mapped by Oscar Brett, Oscar Brett - Breto314@newschool.edu
Cartographer: Stewart Long
Published by gonzoearth
40.730882728896034 N, -73.99735756456181 E
373 views
Ground resolution: 1.4 cm/px
Capture date: 2011-04-27T00:00:00
Publication date: 2011-06-03T00:00:00
License: Public Domain
GrassrootsMapping Washington Square Park - Oscar Brett - Breto314@newschool.edu
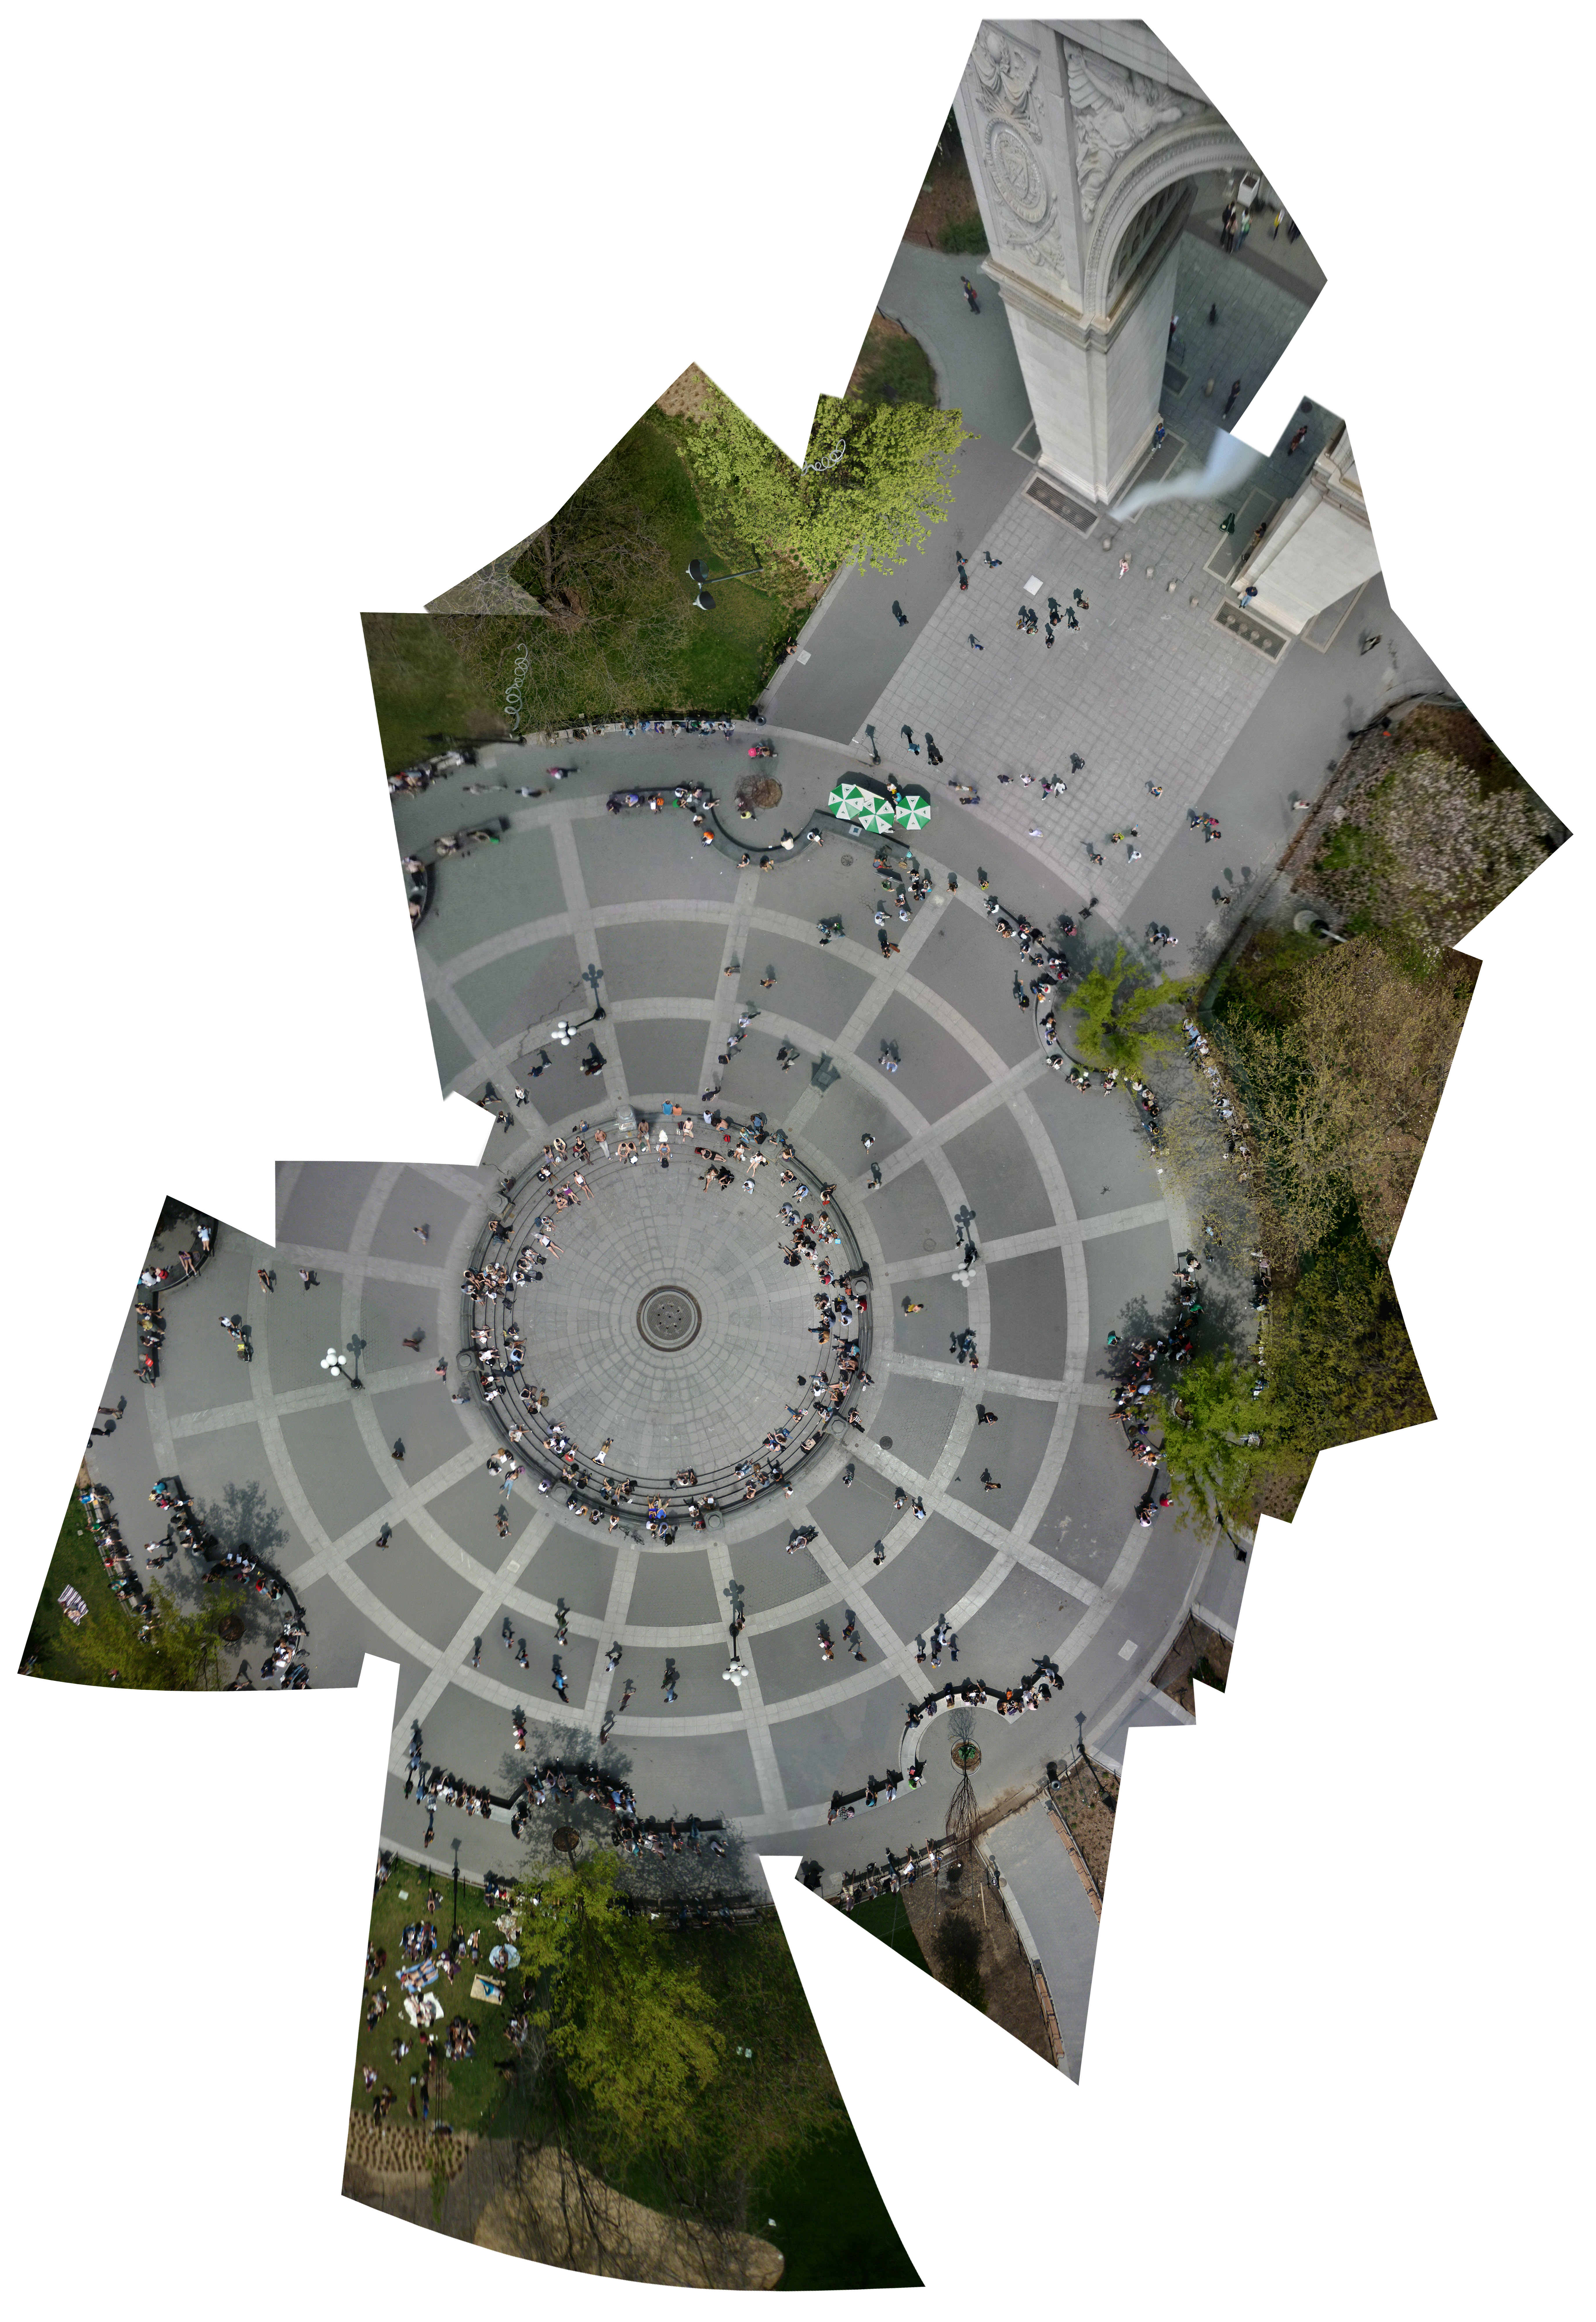
On New York City’s first “summer day” (Tuesday April 25, 1pm), I mapped Washington Square Park. In creating a satellite map I was interested in three things • directly observing people’s sitting, walking, social patterns • creating a notation system by which areal images of people in park spaces can be analyzed • carrying out a cinemetrics style spatial analysis of the park.

As a junior in the Urban Studies department at The New School, I have focused a lot of my attention towards public open spaces. Analysis and understanding space and place is crucial to an understanding of the urban, and whereas before my primary mode of analysis was limited to a street level ethnographies and sketches, now I feel that I can access a more holistic spatial understanding of open public spaces.
≠≠≠≠≠
Notes

I introduced a Bing map overlay of the park and added control points relative to the Bing map. I attempted to match up the fountain from my images with the fountain from the Bing map and manipulate the rest of my JPEGs around the fountain. It was fairly successful; however, the previous Bing map was made before the most recent renovation which recentered the fountain within the park.
After stitching a map, I tried to highlight elements of people socializing in the park. I have, for a while now, been a fan of the works of William H. Whyte. His ability to quantifiably analyze people in space is something that I definitely wanted to emulate. I began with the basics: counting the people, measuring their distances from one another, categorizing social groups by the number of people.

After doing this I began to realize some basic factors that hinder my analysis. A) attempting to perform any measurement of distance would be faulty due to the fact that images are stitched together, B) because the images compiled were taken over a indefinite period of time, people can be depicted more than once (for example, I can be found in multiple photographs). A solution to this problem could have been to fly the balloon far higher, thus capturing the entire park plaza in single one frame (all in one time) However, doing this would mean sacrificing detail.
The implications regarding this map are that we have to see it as a snapshot of one place made of up multiple times, and our viewing of the map must reflect this. This said, the actions of the people in Washington Square Park can only be seen as aggregate and anonymous “possibilities” of social interaction in this specific space-- counting the number of people in the fountain 128 could help to offer some hint towards seating capacity of a non prescribed seating arrangement; also, looking at the number of perceivable smaller social groups could say something about the ways in which people go to parks.
Both William H. Whyte and sociologist Edward Hall write in detail about the spatial habits of people. In Richard Halls book “The Hidden Dimension” he writes on humans as non-contact animals, and how this manifests as unwritten laws of personal space. Hall claims that humans, much like birds on a telephone wire have an uncanny ability to parse themselves evenly in space.
Here we can see not only how people choose to space themselves when confronted with non prescribed seating, but also how people choose to use that seating, note the gentleman laying down still facing the center of the park.

Cimemetrics, devised by Brian Mcgrath, takes the position that mapping currently doesn't take into account the inhabitant’s perception of the space, A bicycle sitting in the middle of a busy park must be seen as being a part of multiple peoples perception, taking on different spatial qualities for each person. Doing this forced me to look at my map differently, as part of a puzzle. The areal map in and of itself is not a sufficient mapping of the space, we must integrate multiple perspectives in order to gain a more full understanding of the space. I have done this by creating depictions of two perception cones, as well as a panorama of the space.

 Panoramic View
 Southwest View

Oscar Brett - Breto314@newschool.edu
Cartographer notes
An exciting map with so much going on in this scene. A real world Where's Waldo style map. Although there were challenges in registering the imagery from the low height above ground level and directional variance of the actual image sensor with individual images, the high resolution provides that extra level of detail that is missing from most aerial maps.
The park just recently was renovated, thus finding observational base data was extremely challenging. I was only able to find coverage of the updated park with 45 degree bing aerial data and OviMaps 3D. Once I had those sources for comparison, I set up my base data for the map by overlaying those sources with the most recent public domain map of the site available.
Making orthomosaics from raw balloon and kite imagery that is this low above ground is typically difficult. The cartography for this map was aided by the anthropomorphic geometric shapes within the scene. Because the image distortion corrections were all unique, the concrete patterns were beneficial in this way. It is always important to register imagery for the ground level, and this kind of ground activity helps in the orthorectification process.
-Stewart
Notes
I introduced a Bing map overlay of the park and added control points relative to the Bing map. I attempted to match up the fountain from my images with the fountain from the Bing map and manipulate the rest of my JPEGs around the fountain. It was fairly successful; however, the previous Bing map was made before the most recent renovation which recentered the fountain within the park.
After stitching a map, I tried to highlight elements of people socializing in the park. I have, for a while now, been a fan of the works of William H. Whyte. His ability to quantifiably analyze people in space is something that I definitely wanted to emulate. I began with the basics: counting the people, measuring their distances from one another, categorizing social groups by the number of people.
After doing this I began to realize some basic factors that hinder my analysis. A) attempting to perform any measurement of distance would be faulty due to the fact that images are stitched together, B) because the images compiled were taken over a indefinite period of time, people can be depicted more than once (for example, I can be found in multiple photographs). A solution to this problem could have been to fly the balloon far higher, thus capturing the entire park plaza in single one frame (all in one time) However, doing this would mean sacrificing detail.
The implications regarding this map are that we have to see it as a snapshot of one place made of up multiple times, and our viewing of the map must reflect this. This said, the actions of the people in Washington Square Park can only be seen as aggregate and anonymous “possibilities” of social interaction in this specific space-- counting the number of people in the fountain 128 could help to offer some hint towards seating capacity of a non prescribed seating arrangement; also, looking at the number of perceivable smaller social groups could say something about the ways in which people go to parks.
Both William H. Whyte and sociologist Edward Hall write in detail about the spatial habits of people. In Richard Halls book “The Hidden Dimension” he writes on humans as non-contact animals, and how this manifests as unwritten laws of personal space. Hall claims that humans, much like birds on a telephone wire have an uncanny ability to parse themselves evenly in space.
Here we can see not only how people choose to space themselves when confronted with non prescribed seating, but also how people choose to use that seating, note the gentleman laying down still facing the center of the park.
Cimemetrics, devised by Brian Mcgrath, takes the position that mapping currently doesn't take into account the inhabitant’s perception of the space, A bicycle sitting in the middle of a busy park must be seen as being a part of multiple peoples perception, taking on different spatial qualities for each person. Doing this forced me to look at my map differently, as part of a puzzle. The areal map in and of itself is not a sufficient mapping of the space, we must integrate multiple perspectives in order to gain a more full understanding of the space. I have done this by creating depictions of two perception cones, as well as a panorama of the space.
Panoramic View
Southwest View
Oscar Brett - Breto314@newschool.edu
Cartographer notes
An exciting map with so much going on in this scene. A real world Where's Waldo style map. Although there were challenges in registering the imagery from the low height above ground level and directional variance of the actual image sensor with individual images, the high resolution provides that extra level of detail that is missing from most aerial maps.
The park just recently was renovated, thus finding observational base data was extremely challenging. I was only able to find coverage of the updated park with 45 degree bing aerial data and OviMaps 3D. Once I had those sources for comparison, I set up my base data for the map by overlaying those sources with the most recent public domain map of the site available.
Making orthomosaics from raw balloon and kite imagery that is this low above ground is typically difficult. The cartography for this map was aided by the anthropomorphic geometric shapes within the scene. Because the image distortion corrections were all unique, the concrete patterns were beneficial in this way. It is always important to register imagery for the ground level, and this kind of ground activity helps in the orthorectification process.
-Stewart
2 Comments
Oscar this is such a great note--Unfortunately the links to the images have broken, could you add them again?
Is this a question? Click here to post it to the Questions page.
Reply to this comment...
Log in to comment
Thanks for commenting, nothing to do with Oscar and I did not know it was broken.
Reply to this comment...
Log in to comment
Login to comment.