This is the first of what I hope will be a series of notes related to camera calibration. The intent is to document a process of developing a calibration routine that can be used to improve our ability to create NDVI images from DIY near-infrared (NIR) modified cameras so they can be compared with images acquired by satellites. I will try to explain the process I am using in reasonable detail so it can be critiqued and improved. This first note will provide background information and present initial results.
Camera calibration A goal for many of us who have modified cameras to acquire NIR images is to create NDVI images. A common way to do this is to modify the white balance of the camera or use image math to modify the image until the resulting image appears to have expected NDVI values. This approach works reasonably well if the intent is to detect relative changes in vegetation productivity or health across a single image but has limitations comparing images acquired from other cameras or using the same camera in different lighting conditions or camera configurations such as shutter speed, aperture ASA speed, or white balance.
Another approach is to calibrate the camera using a reference target so the image recorded by the camera relates to a physical measurement. Two measurements that could be used for calibration are radiance and reflectance. Radiance is effectively a measure of how many photons are hitting the camera sensor and reflectance is the intensity of light reflected from a target divided by the intensity of light illuminating that target, often expressed as a percent (e.g., the percentage of incoming light that is reflected off a target). In some ways calibrating a camera to radiance makes more sense since that's basically what a camera sensor is measuring but it's a difficult process requiring specialized equipment. Calibrating to reflectance is a bit easier since published reflectance values for many materials are available in online spectral libraries and calculating NDV from reflectance is often preferred to calculating it from radiance.
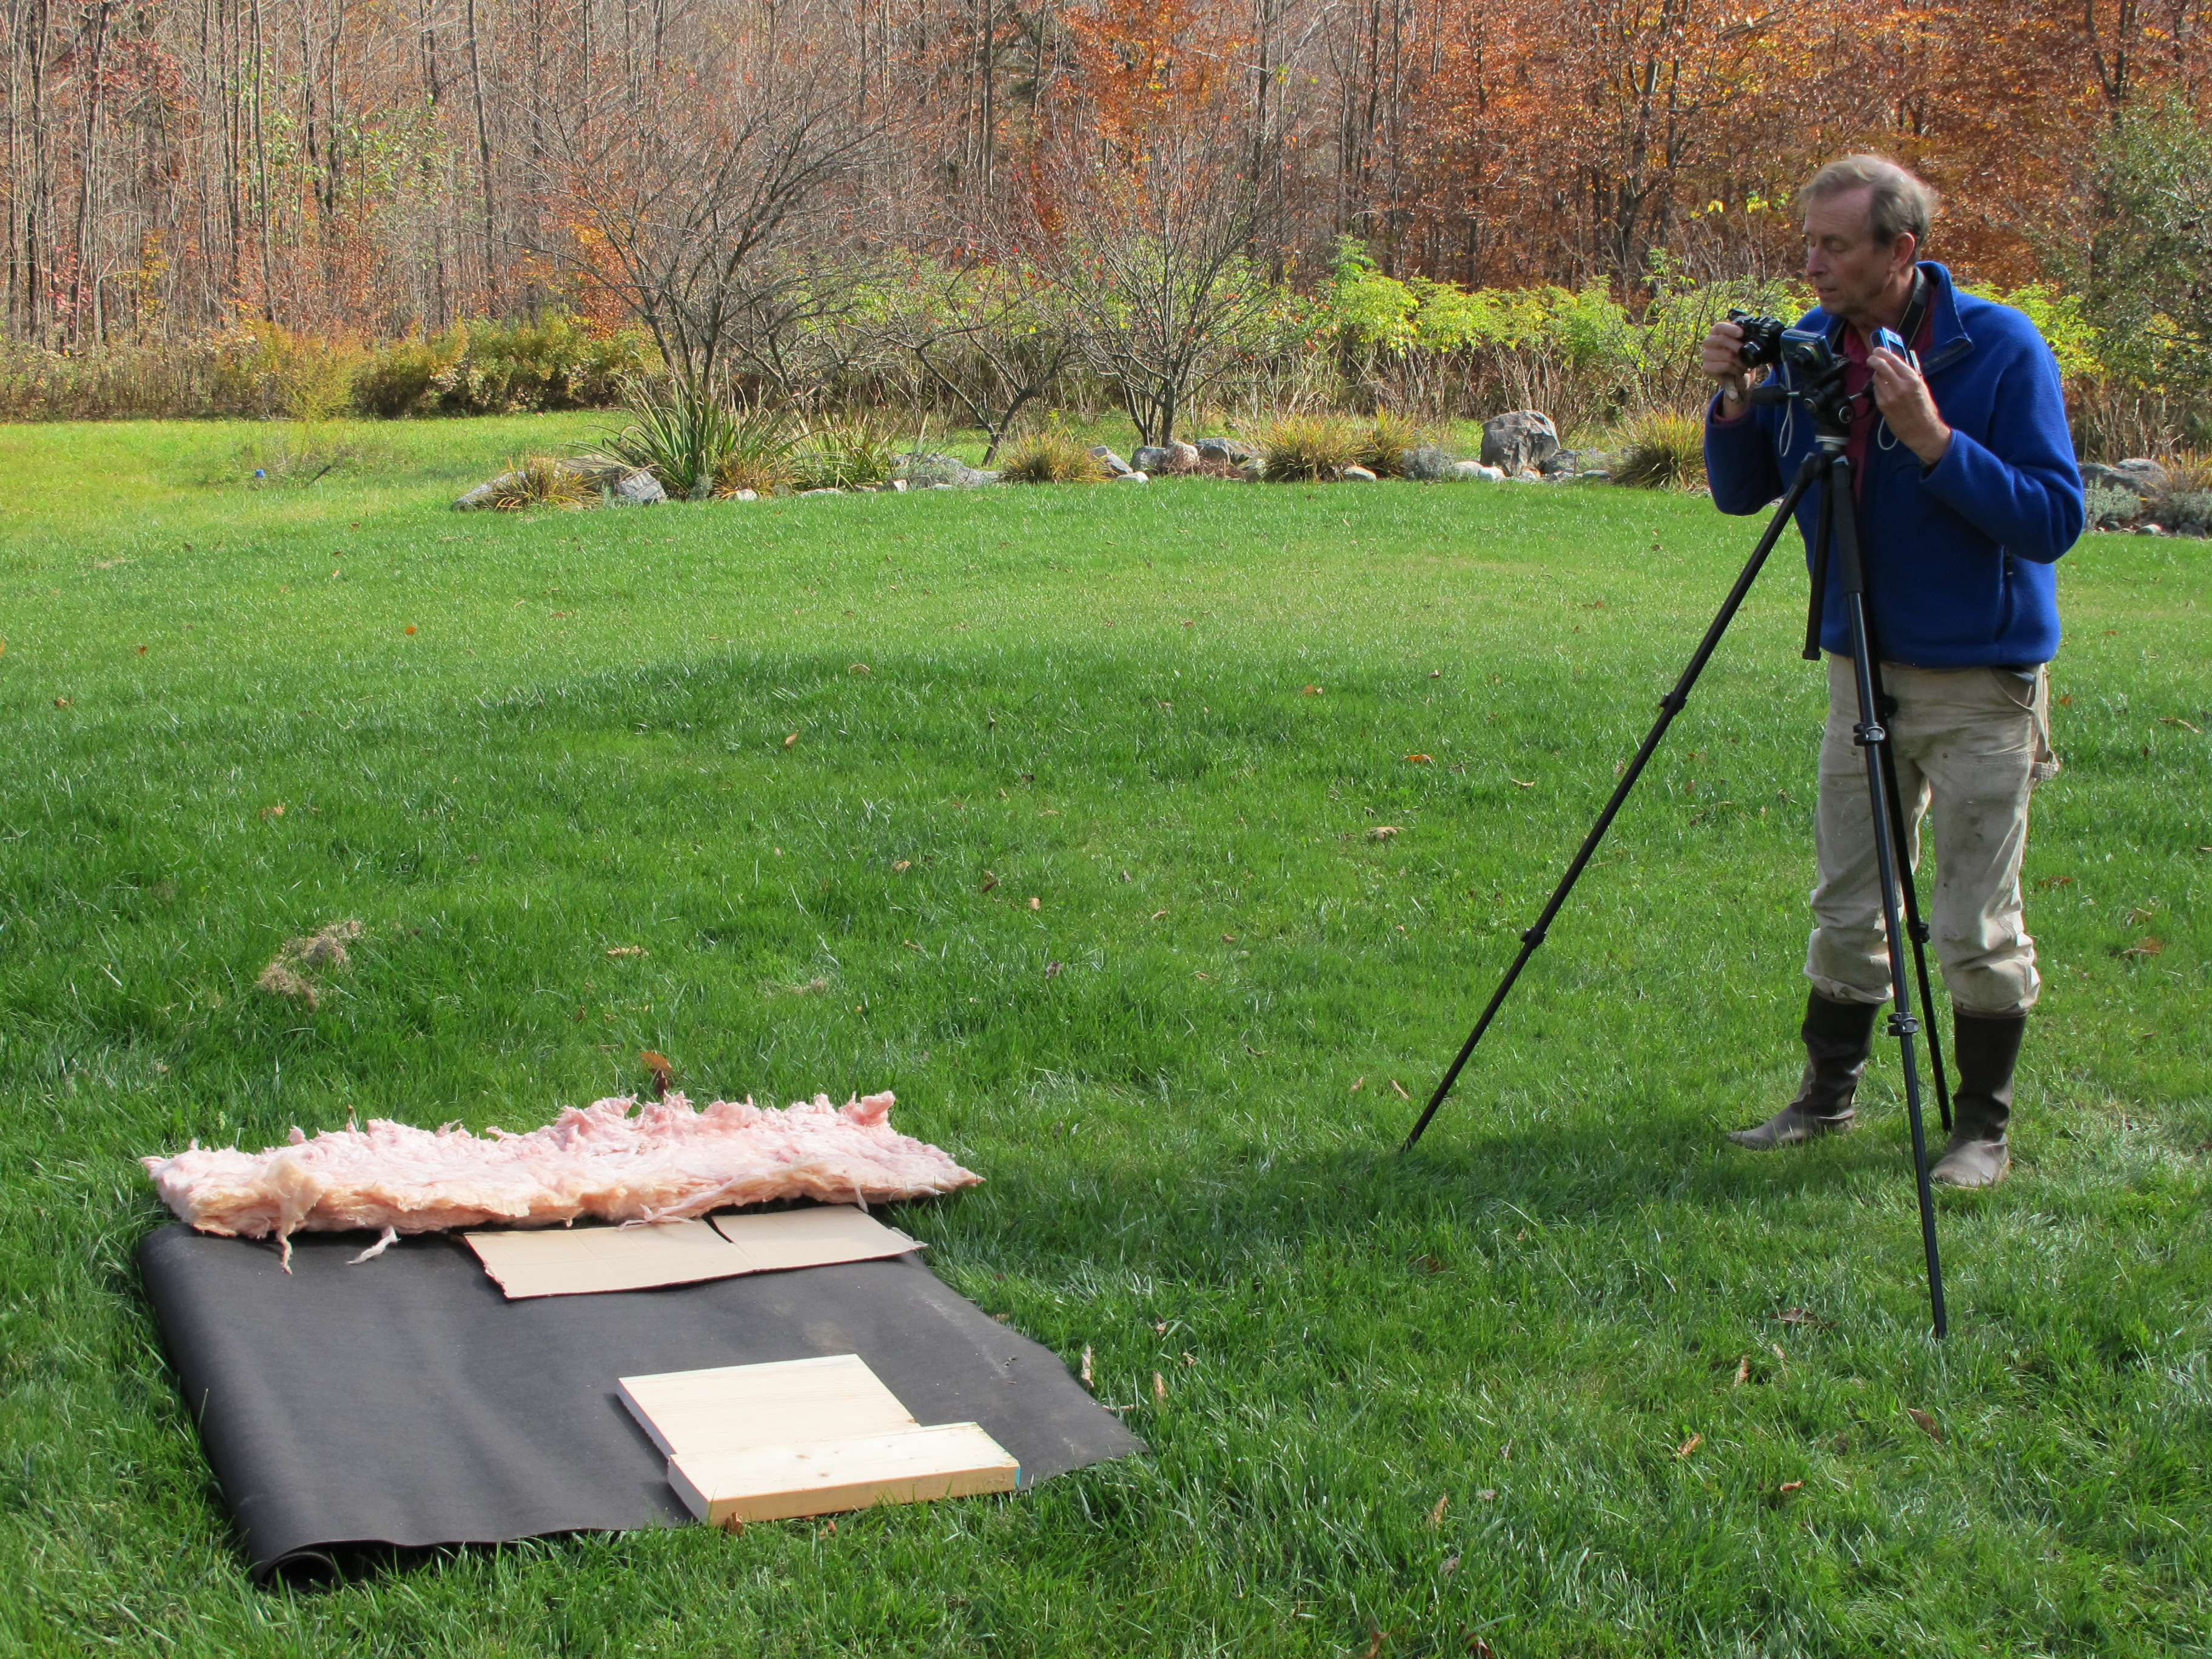
Acquiring the images To start I searched through a few spectral libraries (http://speclab.cr.usgs.gov/spectral-lib.html, http://speclib.jpl.nasa.gov/, http://spectrallibrary.utep.edu/, http://www.frames.gov/partner-sites/assessing-burn-severity/spectral/) to find spectra of objects I had laying around the house. I ended up selecting pine boards (one kiln dried from a lumber yard and one air dried from my property), tar paper, grass, pink fiberglass insulation, and corrugated cardboard. Last Thursday Chris Fastie and I got together to take photos of these “reference” targets. Chris brought a bunch of Canon cameras: G11 with a Life Pixel Super Blue filter, A810 with a Rosco 2008 filter, and a dual visible/NIR camera pair using A495 cameras. All the photos were acquired in (more or less) sunny conditions using exposure compensation settings of 0, -1/3, and -2/3. For each camera we also set different white balances using blue origami paper, a gray cinder block and the “sun” setting available in most cameras. My expectation is that we will be able to generate a similar NDVI images for each camera regardless of the white balance or camera settings.

First test For the first test I selected a photo from the Canon A810 with the Rosco 2008 filter. The shutter speed was 1/250 second and the aperture was 2.8. White balance was set using a cinder block in the shade. The first step was to extract sample pixels from the photo for each of the reference features. That was done in Fiji (a version of ImageJ) by drawing a rectangle or polygon on each target and then using the Analyze => Color Histogram function to calculate the mean pixel value for each band of the pixels bounded by the rectangle or polygon. These values were pasted into an spreadsheet.
![]()
 InfraBlue image with a selection polygon on the pine board and the resulting average pixel values for each band
Material |Red band |Green band |Blue band
----------------------------|:--------------:|:--------------:|:--------------:|
KD pine board |193.95 |165.62 |122.45
Ripton white pine |196.38|162.32|112.68
Cardboard |180.63|149.1|108.9
Tar paper |42.6|32.82|28.32
Grass |180.06|119.44|57.58
Table of average pixel values for each calibration target in the photo
The values under each color are the average pixel value of the pixels extracted from the photos. The reference reflectance values from spectral libraries were also entered into the spreadsheet.
Material|Ref 400|Ref 450|Ref 500|Ref 800|Ref 840|Ref 900 -----------------|------------|------------|------------|----------------|-------------|-------------- KD pine board|10.79|23.85|36.19|89.95|91.39|91.90 Ripton white pine|10.79|23.85|36.19|89.95|91.39|91.90 Cardboard|7.456|10.15|13.34|43.74|48.08|51.55 Tar paper|2.26|2.35|2.43|2.91|2.97|3.10 Grass|3.82|4.12|4.54|48.432|49.37|50.79 Table of percent reflectance values copied from spectral libraries for the target material
The columns hold the percent reflectance values for each material for the wavelength noted in the column label. (e.g., Ref400 = reflectance for 400 micrometers wavelength)
Using these data I calculated the following 12 linear regressions:
- Ref400 (dependent variable) vs Blue (independent variable)
- Ref400 vs Blue + Green
- Ref450 vs Blue;
- Ref450 vs Blue + Green
- Ref 500 vs Blue
- Ref500 vs Blue + Green
- Ref800 vs Red
- Ref800 vs Red + Green
- Red850 vs Red
- Ref850 vs Red + Green
- Ref900 vs Red
- Ref900 vs Red + Green
Regression coefficients and R squared values were calculated and plots of the regressions with a single independent variable were created. You'll note that the pink fiberglass insulation isn't included in the list of materials. The graphs showed the insulation to be an outlier so I removed it from the list. The insulation was a bit old and it didn't look like “fresh” insulation so I figured it was not very similar to the insulation used to record the reference reflectance I got the the spectral library.


The results indicated that the best fit for the simple regression (using a single independent variable), based solely on the R2 values, for the blue band was Ref400 and for the red band the best fit was with Ref900. In addition to simple regressions I ran regressions using two independent variables to see if adding information in the green band would improve the results. I did this since there appears to be green light leakage in the blue band and also the NIR band (red).
The next step was to create NDVI images by applying the regression coefficients to calibrate the blue and red bands and then calculating NDVI. I created a script in the open source statistical software R to create the NDVI images. The range of NDVI values in the images is from 0 to 1. NDVI values less than 0 were set to 0. I used a continuous color table to make it easier to notice differences between images. Below are the results. See the color table for an indication of NDVI values.
NDVI

 NDVI created using the ImageJ/Fiji plugin with no stretch
 NDVI created using the ImageJ/Fiji plugin with saturation = 2 stretch
NDVI

 NDVI from simple regression calibration
 NDVI from multiple (blue + green and red + green) regression calibration
As a reference for NDVI I calculated the NDVI values for the reference materials using the data from the spectral libraries for 400 and 900 micrometer wavelengths. To compare these with NDVI that would have been calculated using wavelengths similar to those used to create NDVI with Landsat Thematic Mapper data I also included NDVI values calculated using 650 and 840 micrometer wavelengths.
Material|NDVI (900/400)|NDVI (840/650) -----------|-------------------------|--------------- KD pine board|0.79|0.08 Ripton white pine|0.79|0.08 Cardboard|0.75|0.24 Tar paper|0.16|0.05 Grass|0.86|0.82 Table of NDVI values using the blue band (400 µm) which are what we expect from an InfraBlue photo and the red band (650 µm) which is what we would expect from a Landsat TM image
From this table you can see that the NDVI values for vegetation are similar when we substitute the red wavelengths (~650 µm) with blue light (~400 µm) but there is a very large difference in NDVI values for non-photosynthetic targets. I'll write more about that in a future research note.
Next steps These calibration results are encouraging. Now that I have a work flow established it will be relatively easy to do additional comparisons. The next research note will focus on calibrating of images acquired with the same camera but using different exposures and different white balance settings. After that I'll process the photos from the G11 SuperBlue camera and then finally I'll see how well the calibration works for the dual-camera visible/NIR setup. In the meantime any comments are welcome. I loaded up all of the photos the spreadsheet and R script in case anyone else wants to work with these images: ftp://ftp.amnh.org/pub/people/horning/CalibrationTestPhotos.
18 Comments
Ned, This looks very interesting in getting at ways to make NDVIs that are quantitatively comparable. I'll keep following it. Kudos to you for this and the tools you've provided to make exploring making NDVIs much more accessible.
Reply to this comment...
Log in to comment
Ned, This is a substantial advance, and an excellent explication of it. I like your statement of the problem – that what we have been doing with the Infragram so far is okay “if the intent is to detect relative changes in vegetation productivity or health across a single image.” You make a really important point that comparing NDVI results among images from different cameras is prone to errors and even comparing NDVI from images made with “the same camera in different lighting conditions or camera configurations” has limitations. It is really important that this approach might allow us “to generate similar NDVI images for each camera regardless of the white balance or camera settings.” This will be crucial if we want to use inexpensive cameras with no capability to alter white balance settings. Question: You mention that “camera configurations such as shutter speed, aperture, ASA speed, or white balance” can affect NDVI results. I can‘t think of a way that shutter speed or aperture by themselves could affect color balance, although bright and dark exposures of the same scene might have different relationships between channel values. I am also unsure how much ISO would affect NDVI, but it probably does change color balance a little. Is that what you were thinking?
Have you been able to identify any materials that reflect in the intermediate range which is empty on the current graphs? It would be good to fill the gap between 60 and 100 (blue) or 50 and 170 (red). I wonder if this would change your result that found that the blue channel was associated more strongly with 400nm than with 450nm which I thought was more representative of that channel. For the NIR channel, the cameras probably records between 750nm and 900nm, but the reflectance of the selected materials does not vary much across that range, so it doesn't matter which reference wavelength is used.
To help us replicate your procedure, we might need some help when you get to this point: “The next step was to create NDVI images by applying the regression coefficients to calibrate the blue and red bands and then calculating NDVI.” Is the result of that step to change the values for each pixel in the blue and red channels of the infrablue photos so that e.g., in the graph “Ref400 vs Blue“ the “Blue band pixel values” (the x axis) for cardboard are changed from around 108 to around 95 (on average)? Maybe Jeff can suggest how this could be done using Infragrammar at the Infragram Sandbox after the regression equations are in hand.
The NDVI from simple and multiple regressions do not differ much. How would you tell which is better?
NDVI based on reflectance calibration are higher than uncalibrated results by about 0.3, which seems to be a lot. Is 0.85 an expected result for NDVI of healthy grass? In other words, are the calibrated results reasonable?
The color table you used seems to assign red to values near 0 and also to values near 1. That made my head hurt a little.
I think this line of inquiry is headed toward a protocol in which a card with several colors of known reflectance (e.g., at 450nm and 800nm) is included in each Infragram photo taken (or at least the first photo of a series under the same conditions). That will be very geeky.
Is this a question? Click here to post it to the Questions page.
Reply to this comment...
Log in to comment
Thanks for the comments Chris. I might have overstated the influence that different shutter speed, aperture and ISO could affect NDVI but I expect they do have some influence. I am working on the assumption (mostly a guess) that changing those values does not have the same effect on each band. For example if you halved the shutter speed you would have half the light hitting the sensor but I expect that the camera processes that in such a way that the output for each band is not halved unless you were shooting in RAW mode. That just a guess on my part but it should be easy to test.
It would be good to get additional targets to fill in the gaps that you mention. At this point I'm tempted to see if we can find a spectrometer to measure reflectance of different colors of construction paper or something like that to see if that can fill in the gaps and also provide an easier DIY solution for calibration - like the card you mention. The downside is that it might take a while to do this unless someone is willing and able to help.
Applying the regression coefficients is just applying a gain and offset to each image. You multiply each pixel value by the slope (gain) and add the intercept (offset) for the blue and red bands then use the resulting images to create NDVI. It should be fairly easy to do using the Sandbox.
I did the multiple regressions mostly out of curiosity. I would need more rigorous methods to assess the benefits of one over the other.
The NDVI values are quite close to the NDVI calculated using the reference data (the last table in the note). Sorry about the color table. I was looking for something continuous and seemed to be better than gray.
I'll try to get some more of the images in a note today or tomorrow comparing different white balance, exposure compensation settings and the Rosco vs G11 SuperBlue. By the end of the week I'll try to add the dual camera comparison which is going to initiate some more discussion. I have all of the processed images on my ftp site now in case you want check them out. The NDVI1 images are from simple regression and NDVI2 is multi-regression.
Reply to this comment...
Log in to comment
Thank you very much Ned. This information will help me a lot to improve my procedures for agricultural monitoring using NDVI.
Reply to this comment...
Log in to comment
Ned, I have two question:
¿What do you think about using a field spectroradiometer for reflectance values of targets? Do you think that is necessary to repeat the measurements for each two hours during day? I thing that the effect of the sun azimuth and amount of light could be an issue but I'm not sure.
Thanks in advance.
Is this a question? Click here to post it to the Questions page.
Reply to this comment...
Log in to comment
Hi - Using a field spectroradiometer for getting reflectance values of targets is a good idea. It would probably be best if you can take reflectance measurements periodically throughout the day but it should be critical if you don't since reflectance (assuming that is what you will measure with the spectroradiometer) should change with different illumination. There are a lot of caveats with that statement mostly due to the fact that your camera is recording very broad bands in the red, green, and blue channels. Anyway it would be a good experiment to test how important it is to take periodic reflectance measurements.
If you are recording radiance instead of reflectance with the spectroradiometer then you will need to take frequent measurements since radiance is directly related to incident light intensity.
Sun angle can have an impact. To reduce sun angle effects it's best if the entire scene being imaged has the same sun-target geometry but if that's just about impossible when imaging vegetation (the blades of grass or tree limbs/leaves are angled in many different directions) but you can try to do the best you can. I would also suggest that you take the photos either from nadir (camera aimed straight down) or from and oblique angle with the camera pointing 90 degrees on either side (+ or -) of the solar azimuth angle.
Reply to this comment...
Log in to comment
Hi Ned, I'm newbie here so I hope my comment will be read. I also apologize in advance for all the language mistakes i'll do during this conversation. I'm really interested in apply the NDVI monitoring method in my region.
Please read this comment as a tutorial need, by a self-taught...
As all DIY people I've started with what I've had by hands, so my modified camera is a CANON eos 30d (no more IR-UV cut). My first question is on the filter type to choose, at the moment I'm waiting for a samples rim from LeeFilters in order to try the #21 and the #26, On Rosco filters, that is mentioned on some pages in didn't find the #21. I'm also wondering about purchasing the XNite71585 and 78058 from Maxmax.com. The topic question is would the photomonitoring plug-in work with a NIR photo taken by my eos 30d (18-55mm) and a visible one taken by a eos 40d (same optics). I've read that the photos should be as similar as it could be, and I know that even with the same optics, set ups and format size, the Mpixels number vary from 3504x2336 pixels from 30d camera to 3888x2592 pixels from the 40d camera.
I've taken the 40d because it was a real deal, less than 5k shots and verified assistance for 150€... Right now I want to know if I'm hanged up and need another camera, or if somehow it could work anyway.
Thanks Giovanni.
Reply to this comment...
Log in to comment
Hi Giovanni -
You should be able to use the photo monitoring plugin to process images from different cameras even if the cameras have different sensor size and resolution. You will need to make sure the variable for the transformation type is set to "affine". I haven't tested that thoroughly but as long as the camera pose and location of the two cameras are not very different it should work reasonably well - but probably not as well as using cameras with the same image dimensions and resolution. If you proceed with your work I'd be interested to hear how well it works.
All the best,
Ned
Reply to this comment...
Log in to comment
Thanks for your kind answer Ned:
I will try to start the experiment of the spectroradiometer on the calibration targets during different times of the day during this month. Also, I was thinking about to repeat the experiment of June, September and December, to evaluate the effect of the seasons (basically the astronomic position of the Earth relative to the sun). I forgot to tell you that I'm carry on this experiment to have regression(s) equation(s) that could be used in any time of the year for any photography and calculate vegetation indices.
By the other hand, sometimes UAV companies argue about the real use of the radiometric calibration if UAV's photographs are going to be always affected by many variables like shadows of the clouds, morning dew or low altitude gases in the air. What do you think about that?
Is this a question? Click here to post it to the Questions page.
Reply to this comment...
Log in to comment
The value of camera calibration depends on what you're doing. If you're just looking for relative differences across an image calibration isn't all that important. If you want to compare images from different dates it becomes more useful but for that you could always use image normalization techniques instead of calibration. Calibration is probably most useful if you want to compare images from different sites. There are normalization techniques you can use for that but having a calibrated camera might be easier.
As far as the different factors that can distort surface reluctance reading I think some of the biggest ones are a result of use taking ultra-high-resolution images. For example the geometry of blades of grass or leaves in an image will be radically different through out the image and when it takes multiple pixels to cover a leaf that will impact your spectral readings for a single leaf. In general, making sense of ultra-high-resolution imaging can be pretty messy but it's an area of active research with many of the neat advances coming from the computer vision field.
A few thoughts,
Ned
Reply to this comment...
Log in to comment
HI Ned, I find your notes quite informative. The photo monitoring plugin is a great tool you developed. You also mentioned in your note about the R script to do image digital number conversion. Actually I'm curious to try that out on my raw images but the download link seems dead. I was wondering if there is any working link available ? Thanks, Dj
Is this a question? Click here to post it to the Questions page.
Reply to this comment...
Log in to comment
Hi Dj - Can you let me know which link you refer to? I have a few scripts that mostly deal with image classification and regression at https://bitbucket.org/rsbiodiv/. I have a lot of other scripts that haven't made it to the Bitbucket site that I'm happy to share but many are not well commented at this point. I have a couple that I use for calibrating RAW imagery. If those are of interest I can send them by email or post to an ftp server. One caveat is that I'm traveling so it might take a few days for me to do much of anything until I have Internet connectivity.
Is this a question? Click here to post it to the Questions page.
Reply to this comment...
Log in to comment
Ned- It was this link: ftp://ftp.amnh.org/pub/people/horning/CalibrationTestPhotos.
Reply to this comment...
Log in to comment
Ok - That site was taken off line last year I think - sorry.
Reply to this comment...
Log in to comment
Dear Ned, First of all i would like to appreciate and thank you for posting such an interesting research article. I am typically in dilemma regarding the spectral calibration of my mobius action cam (87 mm wide angle with Rosco 19 Fire red filter modified from Public Lab). I have scanned some Reflectance targets like (white A4 paper, green targets, red targets, packaging brown paper, foam for packaging) with Spectroradiometer (which has range 0-860 nm).
By spectral calibration, as i have understood so far, its changing the white balance settings of my mobius action camera through the gain and offset that i would obtain from the regression equation. Also, the value you applied like Ref400, Ref900, how do you exactly find that. For my work ie.> using Red filter, i have Blue (NIR) and Red is collected in Red channel, so which reference wavelength should i potentially use for calibrating my Blue(NIR) and Red Channel.
You mentioned in a comment above that using Sandbox is fairly easy, how exactly i do this.
Thank you. I look forward to hear from you .
Best Regards,
Suman
Reply to this comment...
Log in to comment
Hi Suman, I haven't tried applying calibration coefficients in any sort of rigorous way to adjust white balance. All of my calibration work has been done with post-processing using my photo monitoring plugin. You could experiment with white balance adjustments using your spectrometer data but I'm not sure how much success you will have. It would be great if you can figure out some sort of relationship between the regression coefficients and white balance settings. Chris Fastie has written quite a bit about his adventures adjusting white balance using colored targets so if you want to experiment with white balance settings I strongly suggest you read his research notes.
For the reference wavelength you can look at the spectral transmittance curves for the filter you are using and pick a wavelength that is roughly in the middle of the band-pass parts of the curve. The band pass width for many filters is quite wide so you could try to take an average but that's probably not worth the effort. It's best if the reflectance samples have a fairly flat spectral curve so you don't have to worry too much about accuracy and precision in selecting the reference wavelength.
If you do some tests you should report back to Public Labs to let us know about your experience - even if the method doesn't work as you had hoped.
All the best,
Ned
Reply to this comment...
Log in to comment
Dear Ned, Oh okay i think i got your idea of calibration. I wanted to know the settings (white balance) which you apply normally when collecting the data from the field. I will have a look to Chris research notes to get the better idea of calibrating using white balance. Similarly, do you have any idea about the spectral response of the mobius action camera? If you dont have that information, could you tell me how i can extract that information on spectral response of the camera.
Thank you for your suggestion on reporting back to public labs. I will definately start reporting once i get some outputs, even if it doesn't work as hoped. My main objective for this research is to monitor the crop health( banana farm) by attaching mobius to the drone and flying on an area of 100 acres. My process involves stiching multiple mobius images (~100 images taken at height of 200m from ground) and creating an orthomosaic from which i calculate the NDVI. Furthermore, i have recently bought image stabilizing gimbal specially designed for mobius action camera (picture attached) which is expected to get rid of any jello effect and vibration. I will probably run test flight with that gimbal after i finish my exam (around 2nd week of June) and will definately post my results.
Best Regards, Suman
Is this a question? Click here to post it to the Questions page.
Reply to this comment...
Log in to comment
For calibration I think the most important factor with white balance is that you keep it the same for an entire mission. An advantage to using the white balance methods that Chris Fastie uses is that you can make decent NDVI images even if you are not able to do more rigorous calibration.
I do not have spectral response data for the Mobius so perhaps the best alternative is to look at response curves from other cameras to get a rough idea. Here is a site with a few curves and you will see that they are all quite similar: https://www.maxmax.com/spectral_response.htm
Reply to this comment...
Log in to comment
Login to comment.