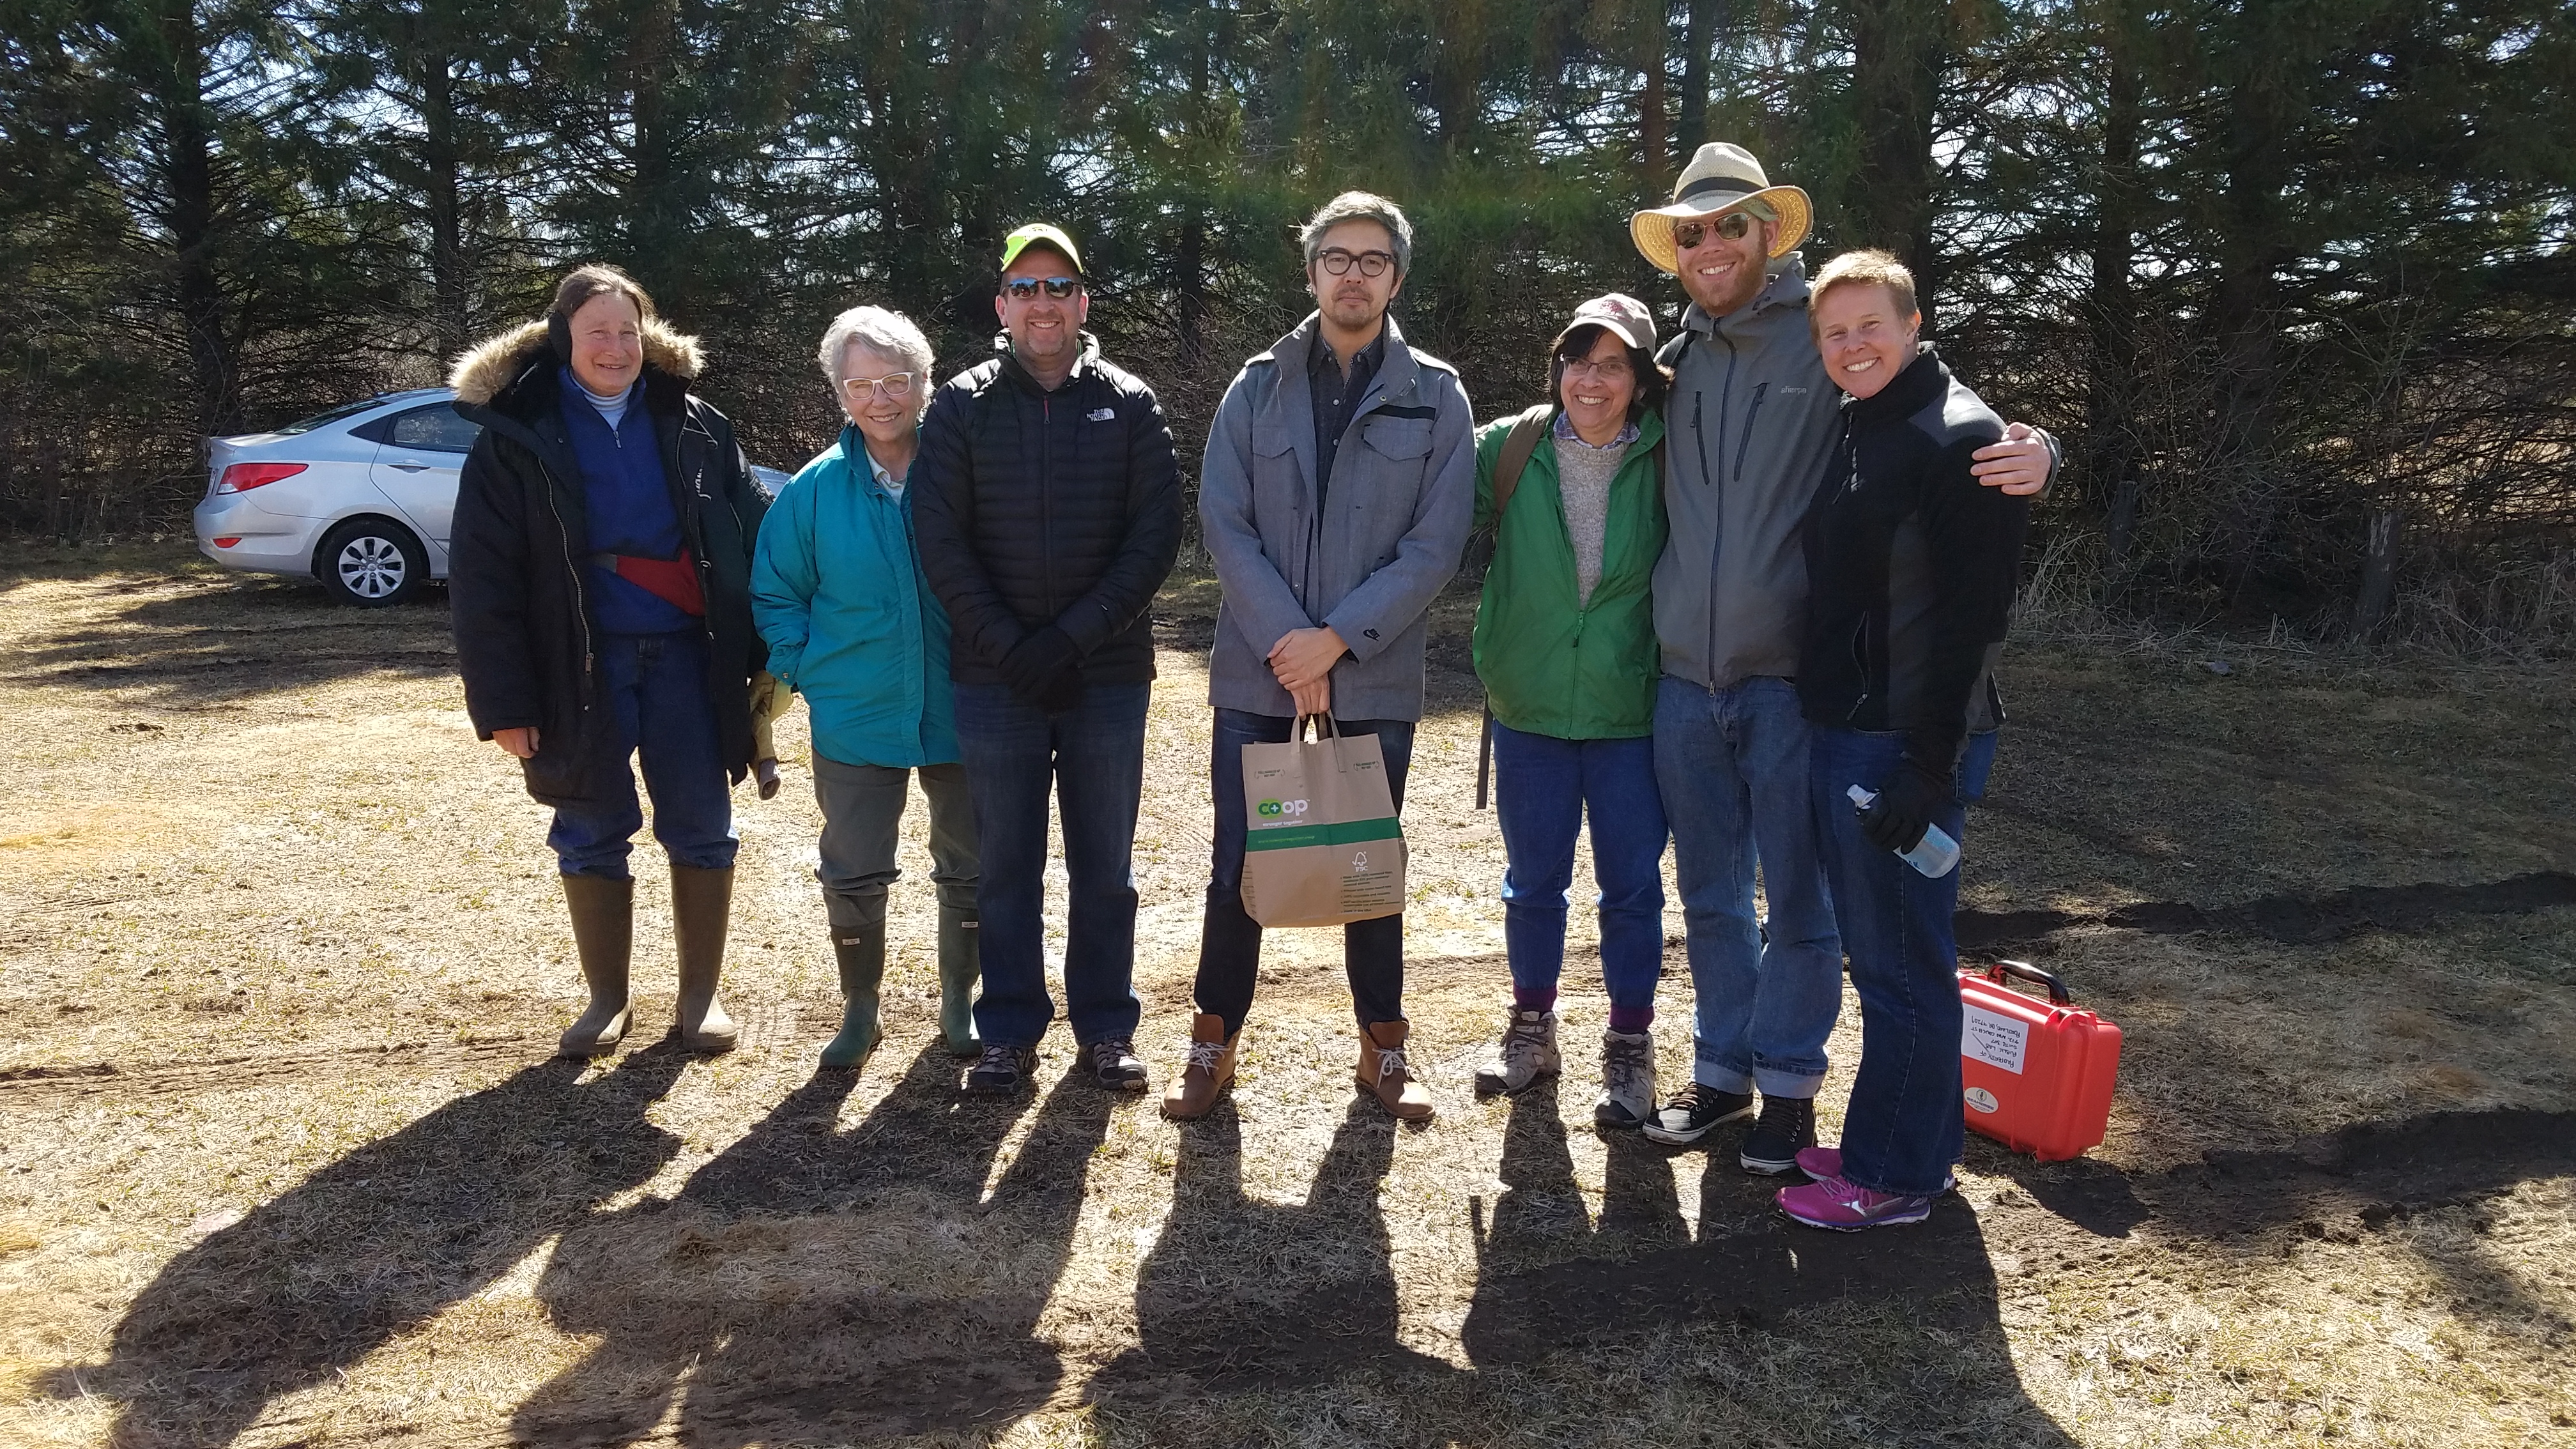
Attempting a Hotspot survey in New Auburn, WI with: @Stevie, @Gretchen, @Warren, @marlokeno, Jonny and Heather.
An Optical PM monitor can be used to take a qualitative survey of the relative PM levels near a source of rock dust, potentially identifying areas of relatively high PM, known as a PM hotspot.
We are aiming to see the relative levels of PM10 in a location with short, 6 minute samples. We can compare values between different sites to see areas of high concentration, but the concentrations themselves should not be considered accurate.
One place where such a survey could be conducted is inthe New Auburn, WI Wildlife Area, which surrounds three sides of the Great Northern Sand Mine in the town of Dovre. We headed out there with a pDR-1500 monitor and a few other tools.
Equipment:
- pDR-1500 (or other optical PM monitor)
- charged/fresh batteries for the PM monitor
- Site Map
- GPS source (in this case a phone app)
- Sighting Compass (a traditional magnetic compass with a mirror)
- Timer (we used a digital watch)
Optional equipment:
- portable weather station (in this case a Kestrel 4500) for temperature/humidity/windspeed data)
- small kite for wind direction above ground level
In our case, we planned our field day hoping the wind would be blowing across the transfer facility and towards our sampling site. It was blowing the opposite direction, however. We continued on as practice.
Understanding the site & making a map
We discussed the New Auburn Wildlife Area site, wind conditions, and access in a question prior to undertaking this practice survey, garnering some local knowledge by also sharing out to the Midwest mailing list.
In that question we used maps from the Wisconsin state DNR to identify the bounds and available parking/entry points. We also used maps from the USGS Topo Quadrant pulled from the National Map Viewer to identify impassible terrain using the USGS Symbol Guide.
We pulled some of this information together into a paper map @warren drafted up for us, and which we used in the field. The grid lines are 1/4 Section subdivision lines) indicating 1/4 mile (1320', about 400m).

Question marks indicate places we thought we might be able to sample at but didn't have time to get to. Sampling locations are noted with their average values, time, and location in blue pen (very small). The crossed-out circle was an area we couldn't get beyond the trees to an open field for sampling.
Settings and setup of the pDR-1500 pre-visit
- replace the filter (links to the activity)
- get fresh batteries (four AA cells)
- set the correct settings
setting the correct settings
we want to set the following settings:
- correct time
- 1 minute averaging
- Inlet type 'total' PM
- RH correction enabled
- units μg/m3
Turn the pDR-1500 on and scroll down to configure. press enter. Scroll to DISPLAY AVG TIME and press enter. use the arrows to set 60 seconds as the averaging time. Repeat this process to set the Inlet to total PM, enable RH correction, and to check that the units are μg/m3.


Identifying sites in the field
Our first priority was to not get stuck in the mud. Since our site was mostly wetlands, this was our most substantial challenge, since the area we were was wetland or prone to seasonal flooding. Luckily, many hands make light work of pushing cars out of the mud.

After driving the perimeter, we decided to enter through the Northern parking area, which would allow us to walk near the mine site.

Our second priority was to follow siting criteria.
Site criteria
We went looking for sites that hewed as closely as possible to the EPA's FRM location standards, which are detailed more fully in this [site survey] activity for the Minivol. We recorded our relationship to trees and clearings in our site notes.
- 2-7 meters (6'7" - 23') above ground level
- at least 30cm (12") from any obstacle to air flow.
- at least 2 meters (6'7") from walls and architectural features
- at least 5 meters from natural gas combustion flues
- away from fuel oil, coal, or solid waste incineration
- at a distance at least twice as far away as the heights of the nearest obstacle that protrudes above the sampler.
- at least 20 meters from the dripline of the nearest tree. If trees are unavoidable, at least 10 meters from the nearest tree with the tree as a noted obstruction
Since the pDR-1500 is a handheld device, I held it out from my face and upwind from my body:


Taking weather measurements
At each site we recorded temperature, humidity, dewpoint, and windspeed from a kestrel 4500. This information was somewhat redundant, as the pDR-1500 also records temperature and humidity. having a separate device aided our manual recordings.

Taking Wind direction & speed measurements
Windspeed could and direction could be estimated with a compass and the Beaufort scale. We chose to use a kite to measure direction above the trees. These measurements were usually 10-15° off of our measurements at ground level.
Taking Wind direction measurements with a kite
Taking PM Measurements
We took 6 minute samples at each site, and we let the pDR-1500 run for 30 seconds to warm up. In order to track when to take readings, a stopwatch is helpful. My watch was easy to use, as its position on my wrist is next to the pDR-1500 in my hand, so I could watch both.

Turn on the pDR-1500, and scroll to OPERATE. press enter, and press enter again when it says START A RUN to begin a sampling period.

We will take readings from the TWA display. Time Weighted Averaging (TWA) displays the average of a defined time period before the present. It is a rolling average, so it changes from second to second. We have the device set to take 1 minute TWA readings, and want to give it time to warm up. We therefore take readings on the 30 second marks: :30, 1:30, 2:30, 3:30, 4:30, 5:30, and 6:30.

To end the sample, press ESC, then Enter.
Recording notes from the different sites
At each site, we took our measurements, and @Stevie, our designated note taker, recorded weather, site info, weather data, and our pDR-1500 measurements in a notebook.

Site 1
Friday 2017/3/31/11:45AM
| Category | Notes |
|---|---|
| Vegetation: | Birch/Pine, near beaver pond |
| Weather: | Clear, partly cloudy |
| Sun: | overhead |
| Wind: | calm 1-5mph from N/NE |
| Lat/Long: | 45.2557/-91.5065 |
| Elevation: | 292m |
| temperature: | 46°F |
| Humidity: | 51% |
| Dewpoint: | 29° |
| Site description: | on a marsh in a clearing about 30 meters |
| PM10 Average: | 8.5μg/m3 |
One minute time-weighted PM10 Measurements:
- 8.5μm/m3
- 8.5μm/m3
- 8.5μm/m3
- 8.5μm/m3
- 8.5μm/m3
- 8.5μm/m3


Site 2
Friday 2017/3/31/12:51
| Category | Notes |
|---|---|
| Vegetation: | Grass, open field 100yds x 100yds |
| Weather: | Clear, partly cloudy |
| Sun: | overhead |
| Wind: | out of N/NE 30° |
| Lat/Long: | 45.25288/-91.58869 |
| Elevation: | 292m |
| temperature: | 50°F |
| Humidity: | 34% |
| Dewpoint: | 26° |
| Site description: | sand piles visible S/SW, 200yds away |
| PM10 Average: | 8.3μg/m3 |
One minute time-weighted PM10 Measurements:
- 8.3μg/m3
- 8.4μg/m3
- 8.4μg/m3
- 8.3μg/m3
- 8.2μg/m3
- 8.3μg/m3


Site 3
Friday 2017/3/31/13:44pm
| Category | Notes |
|---|---|
| Vegetation: | Grassy, 20m clearing |
| Weather: | Clear, partly cloudy |
| Sun: | overhead |
| Wind: | out of N/NE 40° |
| Lat/Long: | 45.2444/-91.58983 |
| Elevation: | 292m |
| temperature: | |
| Humidity: | |
| Dewpoint: | |
| Site description: | 20m clearing with birch stand surrounding, ~20 m depth of trees, sand piles ~100m away due N |
| PM10 Average: | 7.8μg/m3 |
One minute time-weighted PM10 Measurements:
- 7.5μg/m3
- 7.8μg/m3
- 7.8μg/m3
- 7.8μg/m3
- 7.9μg/m3
- 7.9μg/m3


Site 4
Friday 2017/3/31/14:40pm
| Category | Notes |
|---|---|
| Vegetation: | front lawn, trees to West of transload facility |
| Weather: | Clear, partly cloudy |
| Sun: | overhead |
| Wind: | out of E/NE |
| Lat/Long: | 45.20558/-91.56392 |
| Elevation: | 292m |
| temperature: | 56° F |
| Humidity: | 32% |
| Dewpoint: | 37° |
| Site description: | Intersection by road S/SW of the transload facility |
| PM10 Average: | 9μg/m3 |
One minute time-weighted PM10 Measurements:
- 10μg/m3
- 9.3μg/m3
- 9μg/m3
- 8.8μg/m3
- 8.7μg/m3
- 8.7μg/m3


5 Comments
Wow, great post, @mathew! I was looking at the weather meter and it's around $500 used (dunno if there's a better place to buy it) -- https://www.amazon.com/Kestrel-Weather-Environmental-Meter-Compass/dp/B001JEPK1K/
But there are some cheaper and similar-looking devices (even sub-$100) in the "related products" section. Could any of those substitute when you're looking for windspeed?
Is this a question? Click here to post it to the Questions page.
Reply to this comment...
Log in to comment
Absolutely, I should have mentioned them. Here are two:
Reply to this comment...
Log in to comment
Woooow!! Thanks for such a great documentation!
Reply to this comment...
Log in to comment
Nicely done @matthew. I'm sure you all had a lot of fun. A few comments: Sometimes the text says the monitoring is for pm10 whereas the notes say pm2.5 Mines are not always doing the same tasks or even operating. Was the Great Northern mine operating that Friday? Was there any loading of rail cars? If one monitors near a road or intersection it would be important to note any traffic Wind speed is often not recorded after the first site. Does this imply no change from then? Checking the Wisconsin DNR site for hourly pm2.5 readings in EauClaire and LaCrosse would give a comparison and done right could be informative of local vs regional concentrations. I checked and it appears your readings and the hourly readings are basically(in my estimation) consistent. It would be nice to have some overall comments or observations from those who participated. What did you learn? accomplish? insights for future attempts? What did your monitored readings tell you?
Is this a question? Click here to post it to the Questions page.
Reply to this comment...
Log in to comment
You're right I had a typo-- I should have deleted the PM2.5 field. fixed, thanks.
The mine was operational, and they were not loading rail cars, but the facility we visited was loading trucks.
Our windspeed measurements were inconclusive because of the calm conditions, so we largely only recorded the direction.
Agreed, I'd love to hear from the other participants. I hope there is a time to repeat this effort more systematically. The documentation here is to accompany the pDR-1500 as a device available on-loan to whomever wants to use it.
Reply to this comment...
Log in to comment
Login to comment.