Absorption and Emission of Eosin Y in Ethanol
Eosin is a name of several fluorescent acidic compounds which bind to and form salts with basic, or eosinophilic, compounds like proteins containing amino acid residues such as arginine and lysine, and stains them dark red or pink as a result of the actions of bromine on fluorescein. In addition to staining proteins in the cytoplasm, it can be used to stain collagen and muscle fibers for examination under the microscope. Structures that stain readily with eosin are termed eosinophilic.
The name Eosin comes from Eos, the Ancient Greek word for 'dawn' and the name of the Ancient Greek goddess of the dawn.
The main goal of this study was to demonstrate the relationship between absorption of an analyte (chemical compound) and its concentration levels according to the Beer-Lambert law, which states that the intensity of the radiation leaving the substance may be used as an indication of the concentration of the material.
I also did an emission scan using my 532nm DPSS green laser because I redesigned the entrance slit for my spectrometer and I am using a 0.09mm slit width, and wanted to calculate the signal to noise ratio of changing the slit width and gauge my resolution.
Sample preparations are as follows;
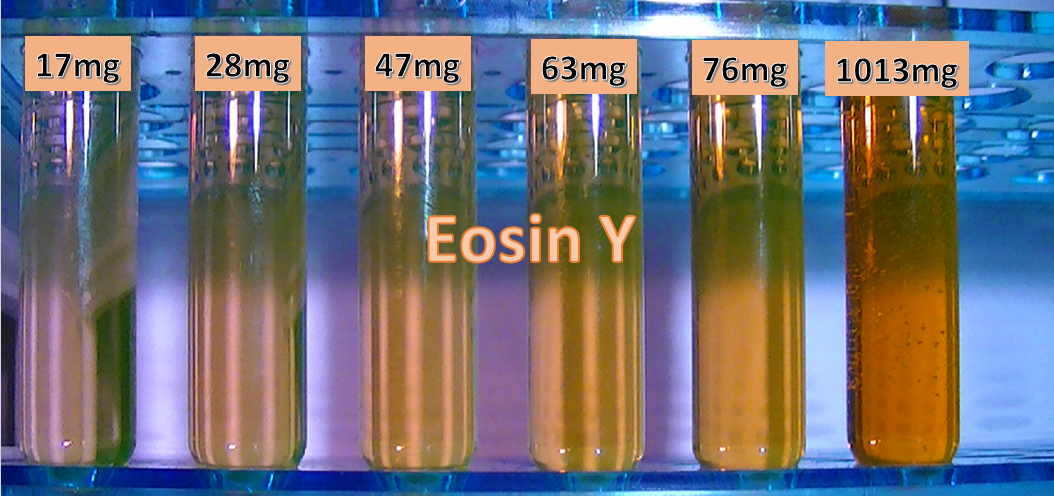
Using 6 13X100mm glass test tubes with screw tops, from Karter scientific (402D2,) each test tube was labeled as AB08-SeY [1] thru [6] Batch#03. Using a 1000micro liter pipette tip, inserted into a glass eye dropper, each drop of Eosin Y was weighed on a lab quality digital scale from 1 to 54 drops for volume weight per drop, then the appropriate sample quantity was transferred to each test tube.
Per drop volume weight is: 0.017g*1000 = 17mg.
1 drop of Eosin Y in test tube#1 - 17mg 2 drops in test tube#2 - 28mg 3 drops in test tube#3 - 47mg 4 drops in test tube#4 - 63mg 5 drops in test tube#5 - 76mg 54 drops in test tube#6 - 1013mg
Eosin Y was purchased from Aldon Chemical, 5% aqueous solution and is lab grade for biological staining.
*Absorption spectra was acquired using a Solux 4700K 12vdc lamp (forward facing geometry.) 6 sample cuvettes were used, plastic UV disposable (220nm - 800nm) and 1 for the Blank (solvent-Ethanol.)
*Emission spectra was acquired using a DPSS 532nm Green laser (150mW) using a perpendicular(90deg) angle.
After sample concentration amounts were transferred to the appropriate test tube, each was filled with solvent (ethanol) in quantity of: 10ml and lightly shaken and screw tops put on. Using a plastic disposable pipette, 2.5ml was transferred to each appropriate cuvette and capped.
Sample number 2 (28mg) was used as the emission spectral scan as its maximum absorption closely matched that of the Oregon Medical Laser Center's absorption data for Eosin Y in Ethanol (524.80nm) Sample 1 was 524.37nm and sample 2 was 524.41nm.
Excitation wavelength for the laser scan of Eosin Y was 499nm with an emission peak of 543nm, wavelength range for absorption and emission was 356nm - 780nm.
The first plot has the calculations that I used for determining the signal to noise ratio for my emission scan for Eosin Y

The next plot illustrates the absorption and emission for the laser scan of Eosin Y

This is the corresponding absorption plot

This is the calibration curve for the emission scan of Eosin Y using the Oregon Medical Laser Center's data as my reference

The next two plots show the absorption and transmission percentage and supporting data for my Eosin Y samples


The last two plots show the chemical concentration analysis


In conclusion I wanted to also add that, I compared again my scan of Eosin Y in ethanol to that of the OMLC's scan and found with the change in my slit width to 0.09mm, my resolution was enhanced a bit better, although this does tend to increase the noise ratio to some extent, I can remove this noise when processing the data, so it does not pose a big problem.

The wave forms do not exactly match, but there are enough similarities (in my opinion,) that with a slit width of 0.09mm, a spectral bandwidth of 1.6nm and in this case, an SNR of 1.828, that the DH 4.0 v4 spectrometer is certainly moving forward in reaching the goal of begin a serious analytical tool. In the DIY realm of my fellow builders, not bad!
references
http://en.wikipedia.org/wiki/Signal-to-noise_ratio
http://www.iupac.org/publications/pac-2007/1988/pdf/6009x1449.pdf - absorption fundamentals
http://www.rapidtables.com/math/number/PPM.htm#ppm to hz
http://www.leica-microsystems.com/science-lab/fluorescent-dyes/ - absorption/emission eosin y
http://pubchem.ncbi.nlm.nih.gov/compound/11049#section=Top – eosin y
http://omlc.org/spectra/PhotochemCAD/html/061.html - Eosin Y in ethanol
0 Comments
Login to comment.