Abstract
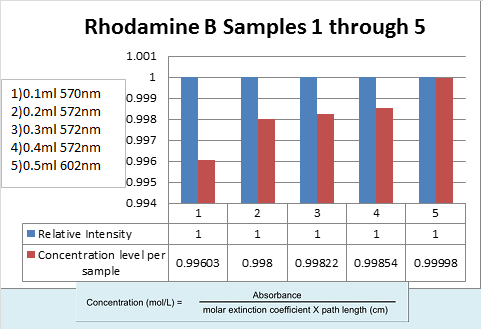
Part two in this series on precision measurements; building on what we have learned so far, the plot for figure 1 shows that sample number 1 @ 0.1 ml concentration, brings us within 5nm of the wavelength taken by the Oregon Medical Laser Center's scan of Rhodamine B in Ethanol (565nm).
Further, it can be seen that the higher the concentration levels become, the greater the wavelength is shifted to the right of the spectrum.

References
http://omlc.org/spectra/PhotochemCAD/html/009.html --Rhodamine b in ethanol
http://i.publiclab.org/system/images/photos/000/015/730/original/eosin_t_in_ethanol_plotnum2apr21.png - explains the spectrum shift for conjugated bonds
0 Comments
Login to comment.