
(note: This has been at the wiki about the PLOTS IR camera tool, but a research note is probably a better place for it. The photos were taken on April 26, 2012.)
I watched the two essential videos that Jeffrey Warren made about post processing near-infrared and visible images to highlight patterns in vegetation and tried to recreate the magic. The first video is about rectifying two images in Photoshop: http://youtu.be/pv6xB0y-rX4. I used this technique to align a NIR image taken with a PLOTS modified Canon A495 camera on top of a regular image of the same scene. The scene is some Trout Lilies in the woods. The second video is about using GIMP to display combinations of the NIR and visible color data to show enhanced patterns of vegetation health and productivity: http://youtu.be/-nNnWEHNO_w. Below are examples of four different ways to highlight patterns of photosynthetically active plant biomass using images from the PLOTS visible/IR camera tool.
It should be possible to do all of this image work with one or the other of the two programs Jeff uses in the videos, but I haven’t figured out how, so I used Photoshop for the rectifying and GIMP for the analysis just as he does (the obstacle with the analysis is that I can’t figure out how to do division in Photoshop).
I did one important thing different from the second video. In calculating NDVI, Jeff added or subtracted the value of visible light from the value of NIR light. Instead of using all visible light (sum of the red, blue, and green channels), I used only visible red light to more closely mimic the way NDVI is calculated from satellite data.
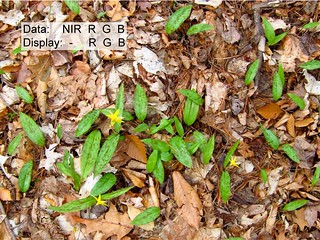 A normal image of Trout Lily with no infrared data. Taken with an unmodified camera.
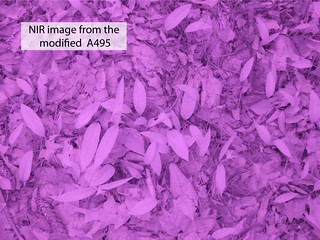 A photo from the PLOTS modified Canon Powershot A495 camera. Visible light is blocked by a filter which replaced the infrared blocking filter in the camera. All three color channels (which are all near-infrared data) are combined and used as NIR data in the images below.
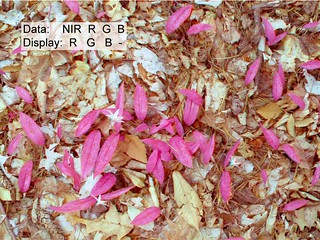 NRG false color infrared. The red channel displays near infrared data instead of visible red data. No blue data are displayed. This is a common way to depict scenes using near infrared satellite data.
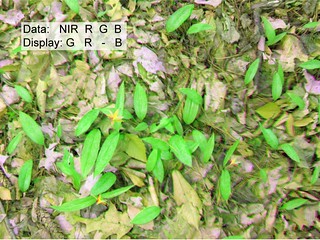 The green color displayed is the near infrared light. This is similar to the normal scene except that NIR replaces green, so there are no green data displayed. This looks sort of like a normal image because both NIR and green are mostly reflected from plant foliage.
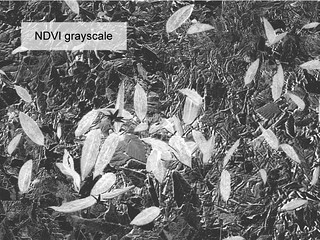 NDVI with the highest NDVI values represented by the lightest tones. NDVI uses the difference between visible red light (which healthy plants absorb) and near infrared light (which healthy plants reflect) to highlight the areas in a scene where the most photosynthetically active biomass is.
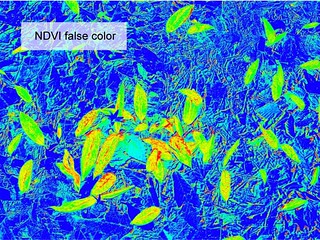 NDVI with the highest NDVI values represented by the hottest colors. From cool to hot: blue, green, yellow, orange, red. Many small red artifacts are present where there are no live plants. This is probably due to poor rectification of the normal and NIR images, but there are several possible causes of erroneous results in NDVI images.
4 Comments
This is Fantastic work! What are your next steps experimentally?
Is this a question? Click here to post it to the Questions page.
Reply to this comment...
Log in to comment
Hi Sara, I tried a few more things last week that I will post soon. One is already here, and I will describe that in a research note in a while. I also have some aerial images with the IR camera pair that I hope to process soon. Lots more psychedelic plants! Thanks, Chris
Is this a question? Click here to post it to the Questions page.
Reply to this comment...
Log in to comment
Amazing! I miss Trout lilies.
Reply to this comment...
Log in to comment
Thanks Scott, I will miss them soon too -- the flowers are long gone and the leaves are starting to fade.
Reply to this comment...
Log in to comment
Login to comment.