On May 5 my Public Laboratory infrared camera made its first photographic flight. The shutters of two Powershot A495 cameras, one modified to record only near-infrared (NIR) light, were triggered every 10 seconds by an AuRiCo KAP controller. The Levitation delta kite hoisted the rig over the northern edge of the Salisbury Swamp, VT. In about 1.5 hours, 420 synchronous pairs of normal and NIR photos were captured. It has taken a while to process just a fraction of these images, but the results are promising. There is more media from this flight here including a Photosynth aerial panorama and also some kite por_n.
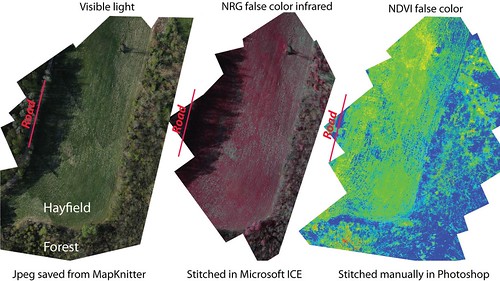
I selected 12 of the pairs of photos and produced 12 false color NRG and false color NDVI images. This process and its background are described here, here, and here. I tried stitching some of the images in Microsoft ICE. This worked reasonably well for photos which included the edge of the hay field, less well for pure forest photos, and not so well at all for the NDVI images. The forest photos are hard to stitch because of parallax -- trees look very different from above when photographed from one side or the other. For this same reason it is very hard to align these forest aerial photos in MapKnitter -- it takes forever to figure out where each photo belongs. The false color NDVI images stitch poorly because detail is lost when the same color is assigned to similar grayscale values. The image below includes results of three different methods of combining images into an orthophoto.
The exciting result from this comparison is that the grassroots NDVI is doing a good job capturing what it is supposed to capture. By comparing the amount of red light reflected from plants to the amount of NIR light, NDVI computations produce an index related to the amount of photosynthetically active biomass present in each part of a scene. Unlike the NRG image, which just displays the NIR light as red, NDVI is a robust index that corrects for varying amounts of incoming sunlight. Large areas of the maps below are parts of a hay field that are deeply shaded by the trees to the west. Both the visible light image and the NRG image show this area as dark and mostly colorless. But the NDVI image paints this area with the same yellows, greens, and blue (for the dead thatch) as the sunny parts of the hay field. This is a good example of the power of NDVI, and an encouraging indication that the NDVI results from the PLOTS tool could have real application in identifying spatial or temporal patterns of vegetation productivity or stress.
My first maps from the PLOTS Visible/NIR Camera Tool. The NDVI image represents the greatest photosynthetically active biomass with the hottest colors (yellow to red). NDVI seems to faithfully represent the productivity of the hay field even where it is in deep shade.
I am getting quicker at rectifying visible/NIR photo pairs in Photoshop and computing NDVI for each pixel in GIMP. But this task is a considerable obstacle to producing extensive NDVI map coverage. Partially automating this process, maybe with scripts for ImageJ, would be a welcome improvement to the current workflow. This post processing issue emphasizes the importance of capturing image pairs with as much overlap as possible to make the rectification and computation most productive.
Tech Notes: Canon Powershot A495, jpeg at maximum quality and filesize, infinity focus mode, widest focal length (37mm eq.), ISO 80 for visible, ISO 200 for NIR, shutter speed priority (via CHDK) at 1/800 second for visible, 1/640 second for NIR, all shots were at f/3 (wide open) so there was just enough light for these settings, no tonal or color adjustments were made before rectifying photo pairs and producing NRG and NDVI images, but the resulting NRG and NDVI images had the levels adjusted to maximize dynamic range. System clocks of both cameras were carefully synchronized before the flight so photo pairs were displayed together when sorted by capture time.


1 Comments
The maps are online now here: http://publiclaboratory.org/map/salisbury-swamp-salisbury-vermont/2012-05-05 and here: http://publiclaboratory.org/map/salisbury-swamp-ndvi-salisbury-vermont/2012-05-05 To see them together in overlay expand the open layers layer toolbar that is on the righthand side of the map viewer
Reply to this comment...
Log in to comment
Login to comment.