About me
Name : Ananya Arun
Email : ananya.arun@research.iiit.ac.in
Location : Hyderabad, Telangana
Github : ananyaarun
Gitter : ananyaarun
Twitter : ananyaarun8
Affiliation: International Institute Of Information Technology, Hyderabad
Project description__
Extend Leaflet Environmental Layers with new layer menu and layer addition workflow
Abstract/summary (<20 words):
Add additional structure to make the display/management of leaflet environmental layers smoother and maintainable and allow better data handling.
Problem
Leaflet Environmental Layers - LEL - is a collection of different environmental map layers in an easy to use JavaScript Leaflet (https://leafletjs.com). This library is rapidly has many new layers being added, but there is no structure or workflow to it. When displayed the layers are not segregated conceptually and is hard for the user to understand the current process.
Project aims to add additional structure to make the display/management of leaflet environmental layers smoother and maintainable and allow better data flow/handling.
Timeline/milestone_s_
Current map page

- There are many layers in the side bar
- These layers are not organized
- Color coding is not very understandable
- There should be more demarcation between base layers and other added layers.
Tasks that can be implemented for better display and management of these layers and to make data handling smoother.
- standardization of layer types (for example tile, rss, csv, geojson, polygonal, also subtypes like spreadsheet, esri)
- and code to reduce redundancy between similar layers, and make adding new layers of a generic type easier
- improved workflow for incorporating and accepting new layers (a submission template)
- a submission form for new layers
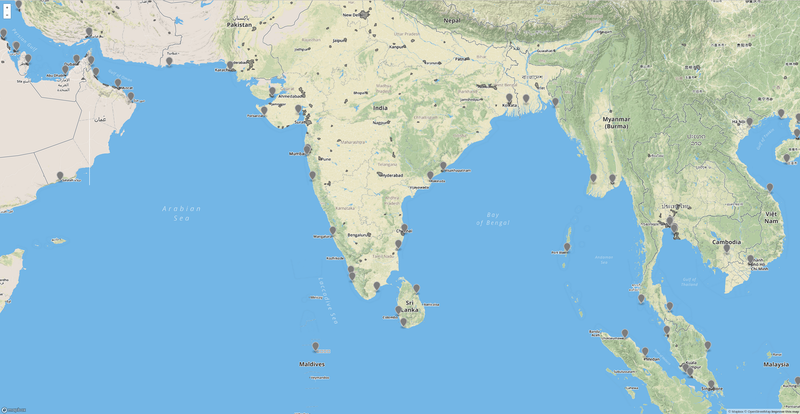
- a minimal 'dots' based display of all layers
- create a tutorial for adding new layers using again a standard template
- create technical documentation for the leaflet layer code
- standardized layer metadata -- description, source, docs for each, relevant bounding box and zoom levels, version, in a single file
- improved layer management system accounting for bounding boxes + zooms from layer metadata
- UI for highlighting (in the menu) new layers in current viewport as you drag/zoom
- standardization of per-item popup design (displaying image, description, source, toggle, link)
- additional layers for oilandgasthreatmap.com, OpenStreetMap tag-based data layers, higher resolution wind data, and more standardization of new map layers
Suggested changes

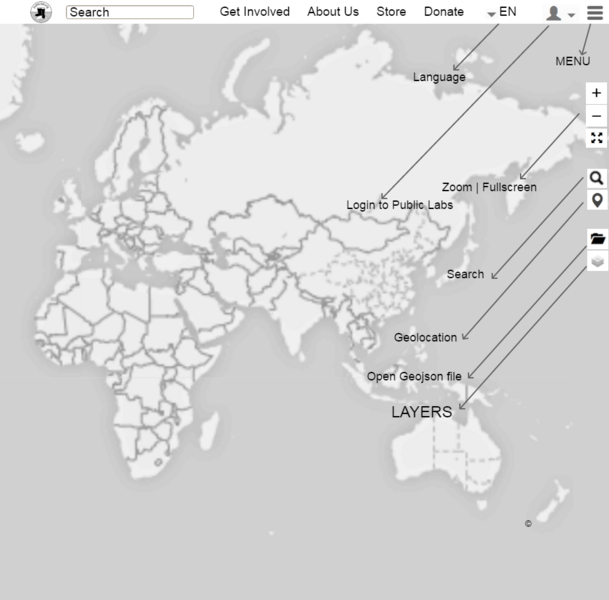
- Add a toolbar functionality with language option and a nav bar design to follow the public lab website UI (NOTE: nav bar is optional considering this leaflet maps will be embedded in other public lab sites and might not need a nav bar)
- Options to zoom search full screen etc can be displayed with icons on the side
- Option to change layers and obtain the geojson files are displayed here too ie users can add their own geojon files for a particular cause to see the map display

LAYER DISPLAY IMPROVEMENT
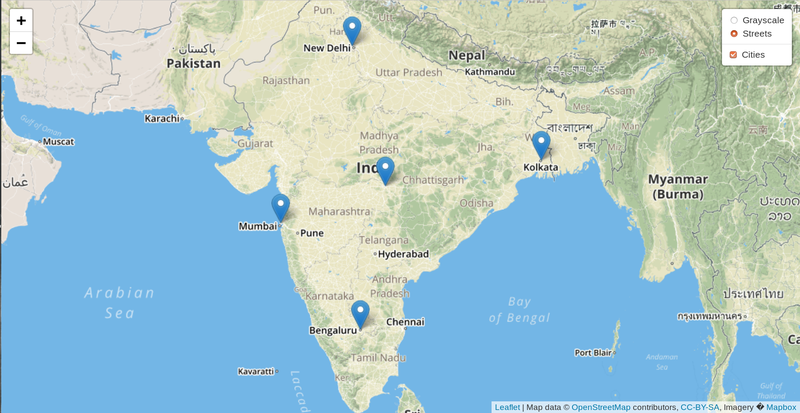
- Add a meaningful name to the base layers and this will be displayed on top like basic, streets etc. Presently working on this issue https://github.com/publiclab/leaflet-environmental-layers/pull/163
- Then one can select particular layers for a specific purpose to display data accordingly
- Layers are hierarchically listed as per public labs data model and they can be added
- An option can be given to change the Geojson files to see and track differences in display of maps
- Color coding of layers can be avoided and layers can be sorted based on type and purpose as shown
NOTE : Leaflet.js library and functions will be used to implement all this https://leafletjs.com/
INTERNSHIP TASKS PLANNED
- Add new layers and look for similarities between them
- Follow the format of this pull request to install a Jasmine test suite, load dependencies, and get "npm test" to pass with a very minimal test: https://github.com/publiclab/leaflet-blurred-location-display/pull/52-
- Connect the test to TravisCI using a .travis.yml file
- Add HTML test fixtures to allow tests to create and initialize a map
- Expand the test to check for proper map setup, following this example of UI testing: https://github.com/publiclab/leaflet-blurred-location/pull/122/files
- Identify common functions we could break out to reduce redundancy between layer code.
- Try making a common function which could be used to reduce redundant code in layers
- Write a test for this function
- Refactor layers to use the common function
- Repeat above for other common functions
- List out the different information which each layer requires, and create a JSON format for storing it in a file. Look for how we can load this information into using CommonJS syntax, like: require('/layers/myLayerName/info.json')
- Try making a standard layer type which would make adding new layers of a specific type easier (for example tile, rss, csv, geojson, polygonal, also subtypes like spreadsheet, esri)
- Improve documentation of the repository to help in the process of understanding and adding new layers
- Develop an improved workflow for incorporating and accepting new layers (a submission template), including a submission form for new layers-Try developing a minimal 'dots' based display of all layers, based on https://github.com/publiclab/leaflet-environmental-layers/issues/123
- Develop a function which scans through available layers to see which overlap with the current map bounds and zoom levels (and expand layer metadata with these new fields if needed)
- Drive consensus on the Public labs data model for leaflet layers which a hierarchical listing of layers. Also drive agreement on a default set of quick select layers for the initial release
- Look for opportunities to breakup some of the internship tasks for newcomers and create FTO issues. Adding an additional layer option once the basic structure is setup could be an ideal FTO Issues.
TIME PERIOD                       TASKS
Community Bonding Period
May 6 - May 20
Refine the proposal and come up with initial hierarchy of layers and quick select and get feedback from the community
_________________________________________________________________________________
PHASE 1
_________________________________________________________________________________
May 20 - May 26                Setup and understand codebase and improve UI for zoom,search etc
May 27 - June 2                Improve Layer display
June 3 - June 9                HTML test fixtures and testing of developed features so far
June 10 - June 16              Add new layers and look for similarities btw them
_________________________________________________________________________________
PHASE 2
_________________________________________________________________________________
June 17 - June 23              FTO's, Documentation, Reviewing PR's  and testing newly added layers
June 24 - June 30              Expand testing for checking proper map setup
July 1 - July 7                Identify and reduce common function and redundant code between layers and test
July 8 - July 14               Testing and Define a template/process for adding new layers
July 15 - July 21              FTO's, Documentation, Reviewing PR's  and testing newly added layers
__________________________________________________________________________________
PHASE 3
__________________________________________________________________________________
July 22 - July 28              Complete the same for all common functions and testing developed features so far
July 29 - Aug 4                Analyze info each layer requires and make a new layer addition template
Aug 5 - Aug 11                 Improve workflow for adding layers and develop minimal display for layer testing
Aug 12 - Aug 20                Develop functions to scan through layers and final testing project
NOTE: workflow and template for adding layers will be made in the middle and final phases after i have myself added new layers and analyzed them and their similarities with other layers. This will ensure more correctness and personalized opinions to design tutorials for newcomers etc.
Needs
I would need the guidance and help of my mentors and community members in reviewing my work and finishing the project.
Contribution
- I have contributed to public lab repositories both frontend (in HTML CSS and JaveScript) and backed in ruby.
- As a contributor i have worked on solving bugs and fixing functionalities and reporting bugs and improvements as issues.
- I also helped create FTO issues to welcome newcomers into the community.
- I broke down big issues in 2-3 FTO's to encourage community growth and participation.
- I guided and reviewed the work of new comers to help them start contributing to public labs.
Issues created by me in Leaflet Environmental Layers:
https://github.com/publiclab/leaflet-environmental-layers/issues/created_by/ananyaarun
PR's raised by me in Leaflet Environmental Layers
https://github.com/publiclab/leaflet-environmental-layers/pulls/ananyaarun
Issues created by me in plots2:
https://github.com/publiclab/plots2/issues/created_by/ananyaarun
PR's raised by me in plots2:
https://github.com/publiclab/plots2/pulls/ananyaarun
Issues created by me in Publiclab.editor:
https://github.com/publiclab/PublicLab.Editor/issues/created_by/ananyaarun
Experience
PROJECT ON LEAFLET
I have worked on a project for Open Street Maps organization.(HOTOSM)
A complete documentation of what i did can be found here.
https://github.com/ananyaarun/Open-Street-Maps
I did the following
- Created geojson vector files
- Set up my own vector tile server using Docker
- Extracted OSM data
- Visualised maps
The map visualized in leaflet.js is hosted here.
https://ananyaarun.github.io/OSM3/

The map visualized in mapbox.js is hosted here
https://ananyaarun.github.io/OSM4/

- I have been actively contribution to open source in the past one year.
I am a member of the opensource development group in my college (OSDG)
and a member of the Lean In circles to encourage
growth and participation in the women in tech community. - I'm a member of the coala organization.
I have fixed issues and reviewed issues in this org.
I have also helped new comers and am an active contributor.
Here are some of my work.
https://github.com/coala/coala/pull/5853
https://github.com/coala/projects/pull/661
https://github.com/coala/coala/pull/5540 - I'm a core member of the Virtual Labs organization known as VLED
which is an MHRD project to make Virtual online labs for all subjects.
I have reviewed over 70PR's in this community across the Labs and was
a mentor of the VLEAD bugathon held for collage students to help find
and fix bugs on github.
https://github.com/vlead - I have also contributed to systers community and sugarlabs in the past.
https://github.com/systers/mentorship-android/pull/137
https://github.com/systers/portal/pull/445
https://github.com/systers/malaria-app-android/pull/324
https://github.com/sugarlabs/musicblocks/pull/1217 - I was mentor for the one million women to tech program this 2018 summer.
I helped and guided and worked with women all over the world to introduce
them and guide them to make small contributions to open source. Some of My projects: I have worked extensively in web dev projects and game development in python Javascript and c++.
I have a strong hold of frontend development in HTML CSS and Java script
and have a strong knowledge of C, C++, Python, Reactjs, Nodejs Go , React native, OpenGL, WebGLNews App in Flask
https://github.com/ananyaarun/News-App-in-Flask- Quiz app in react and go
https://github.com/ananyaarun/React-and-Go-quiz-app - 3D adventure game in OpenGL
https://github.com/ananyaarun/3D-Adventure-Game - WebGL clone of subway surfers
https://github.com/ananyaarun/Subway-Surf - Jet pack Joyride in OpenGL
https://github.com/ananyaarun/Jetpack-Joyride - Mario game in Python
https://github.com/ananyaarun/Mario
Teamwork
I have also worked on the following internships and projects in teams before
- VIRTUAL LABS
Built a virtual Data Structures Lab for MHRD.I worked with a team of 20 interns.
Used pedagogy techniques and literate programming with several Javascript
libraries (Mainly D3.js) to deliver a working app in 2 months. Hosted links http://exp-vlabs.iiit.ac.in/demo.html - BUTTERFLY EDUFIELDS
Worked in a team of four to design a mobile application tool which parses information
such as data or an image through a template e.g. Excel or Jpg and outputs a clickable Html-5 format concept map.
Due to copyright agreement with the company, Source code is not available. - SCHROCKEN INTELLIGENT MACHINES
Working with a team of 3 and my mentor to Implement a Proof of Concept for demonstrating
"anonymous communication" from one-to-many parties on Hyperledger Fabric Blockchain using
Zero Knowledge Proof (ZKP) technology.
Passion
I am inspired by the motive of Public Labs to provide a better and cleaner world to live in. From childhood i have strongly felt the need for environmental conservation. I also love science and the very idea of DIY experiments to learn stuff excites me.
Improving workflow and display of maps would encourage better participation and promote a wonderful community to unite and discuss problems and make a change to this world. Users can use and benefit from these maps. If i can be a small part of this change it would definitely mean something :)
Audience
The target audience of this project are the users of these maps and the website. Improving UI and workflow of the maps will help users better understand use and benefit from them.

5 Comments
@gauravano @waren Here is my draft proposal for the LEL project. All of your feedback and review are most welcome :) Thanks!!
Reply to this comment...
Log in to comment
Hi @anan12 -- thank you!
This is a cool idea! Please note though, that the demo of LEL at https://publiclab.github.io/leaflet-environmental-layers/example/ is intended to show off what the library can do, while it's real usage is embedded in many different pages across PublicLab.org, MapKnitter.org, and hopefully many more as it gets better known!
This is a great idea. I also liked your idea that people could add GeoJSON files!
Very interesting! That's wonderful! No wonder you know so much about GeoJSON 😃
Did you know, over 10 years ago I worked on some of the earliest implementations of vector tiles -- whoa that seems like forever ago! https://ij-healthgeographics.biomedcentral.com/articles/10.1186/1476-072X-9-14
WOW that is a lot of issues!!! Very impressive!!!
Thank you so much for your proposal!
Reply to this comment...
Log in to comment
Thank you so much @warren !! Thats Interesting !! :) I'll continue improving this proposal and learning about LEL :) Also I see this listed as a gsoc project as well ( The exact same project) So can I apply with this proposal to gsoc as well ?
Is this a question? Click here to post it to the Questions page.
Reply to this comment...
Log in to comment
Hi, please upload your proposal at the Google Summer of Code website at the earliest. Please ignore this comment if already done.
@bansal_sidharth2996 , already uploaded it :) Thanks!!
Reply to this comment...
Log in to comment
Login to comment.