What I want to do
I just finished writing a research note (found here) bashing an earlier research note on an amplifying data logger (found here) and it occurred to me that I had never written up the results on the early logger, and that some rather nice (and perhaps useful) things had come out of the work. This note is intended to put those results forward for people's consideration.
My attempt and results
The datalogger in question was designed to accept voltage inputs via british telecom analog (BTA) plugs, amplify the signal, read the amplified signal, convert to the amplified voltage to a digital signal which could then be read and displayed on a computer. While the original plan (to read voltages from Vernier pH probes) was not successful, we did manage to develop hardware and software for measuring and amplifying voltages that might be useful to other people for other applications. To get this working, we plugged Vernier voltage probes into the two BTA connectors and used the "hot" lead to measure incoming voltages. The voltage probes are just connectors that allow you to hook the low voltage read and ground connections of the BTA connectors to something via alligator clips. They are found here. The general setup is shown in the figure below.

Signal generation:
In order to measure voltages, one needs voltages to measure. Further, it would be nice if these voltages could be varied in a controllable and predictable way so that you can tell that what you are measuring is really what you think it is. We chose to generate voltage wave forms using one LaunchPad microcontroller board (the upside down one with the tape on it in the figure above) and read them using the datalogger that incorporated a second LaunchPad (the right side up apparatus). Wave forms with the general formula below were outputted as pwm signals from the generator microcontroller : v(output1) = A sin(Bt) sin(Ct) v(output2) = D sin(Dt) cos(Et) The pwm signals were smoothed out using first order low pass filters with a single resistor / capacitor each (can be seen in the figure). While we could have incorporated signal generation and data logging into a single microcontroller, that somehow seemed like cheating (and would have resulted in unnecessarily complicated code).
Amplifying datalogger GUI
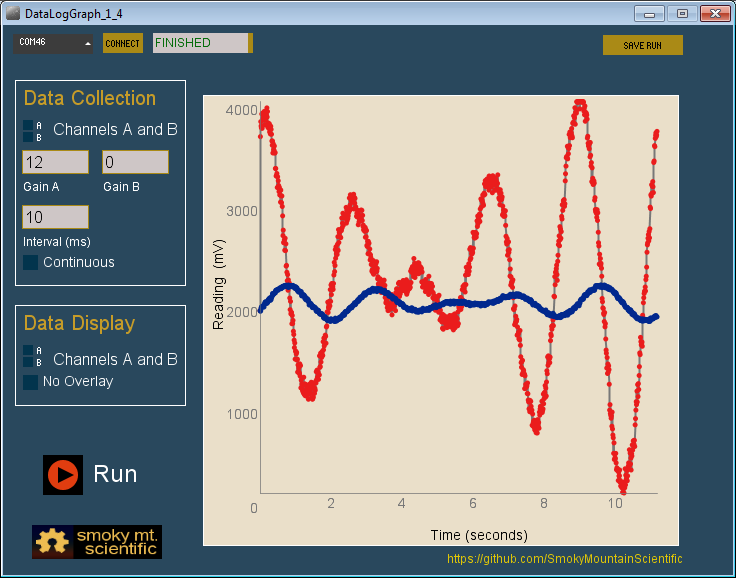
The voltages measured by the datalogger are amplified, converted to digital signals, and displayed on our graphic user interface (see Main Image, above). The GUI allows the user to specify which channel(s) to read (A, B, or both), how often to read, and what the amplifier gain should be for each channel. Data can either be logged in a continuous mode or over a discrete, specified time frame. Data from each channel can be displayed independently, or overlayed, as shown. In addition, the user can opt to overlay subsequent traces by clicking the "overlay" button. Data can be saved between runs as CSV files, and of course there is a run/stop button. The wave forms in the figure above had the same basic amplitude. The red data looks bigger because it was amplified more than the blue data.
Questions and next steps
I think this is all pretty spiffy, but I don't quite know what the application for it will be. I guess I need to put it on my GitHub page.
Links to code on GitHub:
Updated, 11/24/2014. The printed circuit board is available as a shared file from OSH Park. These are archived chronologically and it was shared on 11/21/2014. Eagle files for making the shield (or BoosterPack) are here. Please note that my freeware version of Eagle frequently does not have the integrated circuits that I use and that, therefore, the IC values in the schematic are not necessarily correct. For the correct IC values, please refer to the bill of materials found here. Note that the Vernier BTA connectors are not really needed. You could just as easily attach wires to the board with alligator clips. Energia code for programming the Tiva C LaunchPad microcontroller board that does the data logging is here. This instrument uses a non-standard library for SPI communications to set the potentiometer that determines amplifications. You will need to download the altSPI.h and altSPI.cpp files from here and put them in the libraries file inside your sketchbook. Energia code for the microcontroller board that generates the signal that is read by the datalogger is here. Processing code for the graphic user interface is here.
Why I'm interested
It just interests me, ok? Why do I have to have a reason?
6 Comments
hello Dr. summers,thought I'd pipe in here to express some interest in both the data logger circuitry details as well as your neat GUI. It certainly interests me; I probably could use it for at least a dozen or so things,right off the top of my head! If you could see clear to putting it on either Github or sending it to me, that would be great!
Regards, Mark Rairie
Reply to this comment...
Log in to comment
Hi Mark, Glad to hear that you think this will be helpful to you.
The GUI was written in Processing and the microcontroller software is in Energia. Both can be downloaded for free. The hardware was designed using Eagle freeware. I am not the best GitHub user but I got most of the GUI code at: https://github.com/SmokyMountainScientific/DataLogger2_GUI One problem is that the file extensions did not show up on the file names. They are all supposed to be .pde. Second problem; there is supposed to be a data file that contains little graphics like a logo, the run button, and the checkbox images. I will see if I can get to some of this tomorrow, but it might be next week. right now we are getting toward the end of the semester and I have a whole lot of stuff going on. Jack
Reply to this comment...
Log in to comment
OK, I am making slow, slow progress with GitHub. I put the Energia code for the LaunchPad in the wrong place but you should be able to access it. It ended up here: https://github.com/WheeSci/dataLogger_2. The code that runs the signal generator is really simple and it can be found here: https://github.com/SmokyMountainScientific/SignalGeneratorA. I think I fixed the problem with the file extensions described in the previous comment and I got the data file in the repo as well. I am pretty sure that the Energia code requires the altSPI files (the .cpp and .h files) from here: https://github.com/SmokyMountainScientific/altSPI. These files need to be in a folder called altSPI and that folder needs to be in your libraries folder in your sketchbook. That should be all the software you need. You can order the printed circuit board from OSHPark. I just put it on the "shared projects" list. You can get it from here: https://oshpark.com/shared_projects. Projects are listed sequentially by the date shared and I put it up on Nov 21 at 21:24 military time. Before you order a set of boards (they sell them in sets of three) let me know and I will see if I still have one I can send you. You will also need a solder paste stencil and if I can find it, I will send you mine. Let me know if you want the Eagle files. That might be handy if you wanted to switch out the vernier connections for a bnc connector or something like that. Well, its pushing 5 on a Friday and I think I may have heard the beer siren. gotta go! Let me know if you get stuck. Jack
Reply to this comment...
Log in to comment
Hello Dr. Summers, Thanks so much for getting everything up so quickly; I realise that you have alot on your plate.I appreciate your time! If I have any issues ,I'll let you know. Again, many thanks! Regards, Mark Rairie
Reply to this comment...
Log in to comment
Hello Dr. Summers,I've tested both the Energia code for the Tiva C board, and the Prcessing GUI.It all compiles properly and runs as advertised.I would be interested in the eagle sch. files so I can get the component values for the shield that I'm working on.I appreciate your offer on the extra suface mount board you have,however I'm using through-hole components on my board.When it is built,I'm planning to share some of my application ideas here. Again,Thanks in advance! Regards, Mark Rairie
Reply to this comment...
Log in to comment
OK. Got them up on GitHub. Please see the new section in the body of the Research Note where I (hopefully) have it all chronicled. Jack
Reply to this comment...
Log in to comment
Login to comment.