What I want to do
In Potentiostat Note 3, we described a bug in the timing of the WheeStat 5.1 software that introduced systematic noise into the current dimension (y-axis) of the voltammagrams. In this note I report that we have substantially mitigated this problem.
My attempt and results
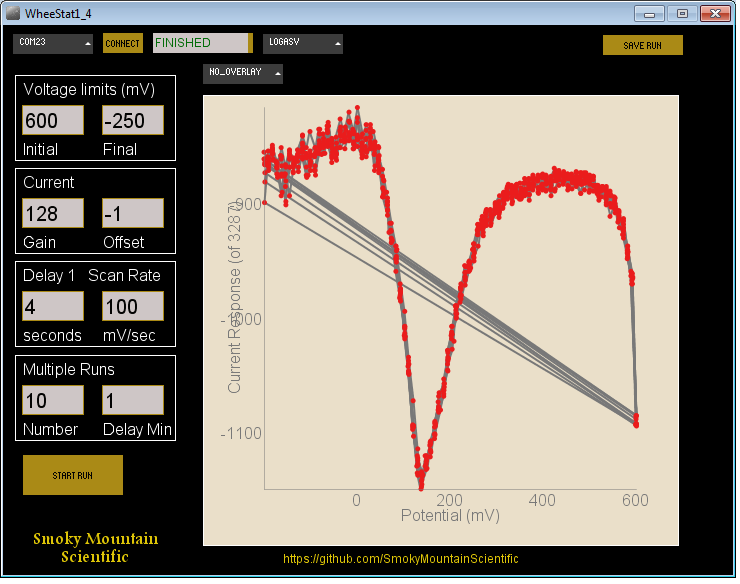
The bug in question introduces systematic noise in the y-axis direction of voltammagrams recorded using the potentiostat. This can be seen in the cyclic voltammagram of 2 mM ferricyanide provided in Potentiostat Note 3 and reproduced below:
 Due to the periodic nature of the noise, we felt that the problem was in the timing of the Energia sketch that runs the LaunchPad development board. Our experiments suggest that the timing error is associated with analog outputs generated by pulse width modulation. In the sketch, we generate 1024 counts on a 5000 Hz clock. I think that this means that the period of the pwm output was ~200 ms. The sketch is currently set up to make ~10 mV steps. Since we were set up with a scan rate of 100 mV / s, that means we were trying to increment the pwm duty cycle every 100 ms, or about half the pwm period. Obviously, this is not possible.
To test this, we doubled the clock speed and looked at the voltammagrams that resulted. The lines in the code that we changed all have the following format:
Due to the periodic nature of the noise, we felt that the problem was in the timing of the Energia sketch that runs the LaunchPad development board. Our experiments suggest that the timing error is associated with analog outputs generated by pulse width modulation. In the sketch, we generate 1024 counts on a 5000 Hz clock. I think that this means that the period of the pwm output was ~200 ms. The sketch is currently set up to make ~10 mV steps. Since we were set up with a scan rate of 100 mV / s, that means we were trying to increment the pwm duty cycle every 100 ms, or about half the pwm period. Obviously, this is not possible.
To test this, we doubled the clock speed and looked at the voltammagrams that resulted. The lines in the code that we changed all have the following format:
PWMWrite(signal_pin, 1024, dSig, 5000);
In this line, signal_pin is the output pin, 1024 is the period, dSig is the duty cycle, and 5000 is the clock speed. We changed the last value to 10000 in each line of code that started in "PWMWrite".
The effect this change had was dramatic. While the CV of 2 mM ferricyanide recorded with the 5 kHz clock speed (above) showed a lot of noise, that recorded with the 10 kHz clock showed none. Decreasing the concentration of ferricyanide to 0.4 mM gave the following CV, and that at 0.08 mM is below that:

CV of 80 micromolar ferricyanide:
 Notice that the voltammagram at the lower concentrations shows less of the signal due to the ferricyanide and is becoming more like that expected for resistor coupled to a capacitor.
Similarly, the differential pulse voltammagram of the 80 micromolar sample at the faster clock speed was vastly improved. The ten voltammagram overlay at the lower clock speed from the earlier research note is reproduced below:
Notice that the voltammagram at the lower concentrations shows less of the signal due to the ferricyanide and is becoming more like that expected for resistor coupled to a capacitor.
Similarly, the differential pulse voltammagram of the 80 micromolar sample at the faster clock speed was vastly improved. The ten voltammagram overlay at the lower clock speed from the earlier research note is reproduced below:

The similar overlay at the higher clock speed (below) shows a significant improvement in the random noise and none of the systematic noise:

From the look of the voltammagrams above, it looks like we should be able to drop the concentration of ferricyanide down another factor of five, but I would need to make another batch of supporting electrolyte, and I really should be preparing for the upcoming semester.
Questions and next steps
Next step needs to be shortening the pwm period. I am not really sure how fast we can run the pwm clock but I suspect we can speed it up significantly (system clock is 80 MHz). We can also speed up the pwm cycle by decreasing the number that we count to. Instead of counting to 1024 and then taking three integer steps, we can make the full cycle equal to VCC*100 (~330). That would make each increment of the pwm output change by 10 mV and cut the period by a factor of three. Then, I need to get the modified code onto GitHub.
ADDENDUM: This morning I pushed the pwm clock speed up to 20 MHz. At this clock speed there is considerable distortion of the pwm signal as observed by oscilloscope (it is no longer a square wave but shows the kind of exponential growth and decay behavior consistent with a circuit of resisters and capacitors). Since we are passing our pwm outputs through low pass filters to achieve a "pure" analog signal anyway, the shape of the output should not matter. Unfortunately, operating at the high pwm clock speed introduces considerable noise into the voltammagrams of the ferricyanide. The figure below shows ten differential pulse voltammagrams of 80 uM ferricyanide overlayed with a 160 kHz pwm clock speed.

The saw-tooth pattern overlayed on the signal in the figure above is clearly not random noise. Backing the clock speed down to 40 kHz returned the signal to its smooth appearance. Looks like I need to go through the Energia sketch and look more closely at the timing. I strongly suspect that the clock speed will need to be adjusted in the code to give an integer number of pwm periods before the duty cycle is incremented. This means it will need to be calculated from the scan rate input by the user. Jack
3 Comments
Hi, Jack -- I've been thinking about what kind of analysis software could make the potentiostat really user-friendly. Do you think it'd be possible to communicate with a web-based app on a smartphone via the audio port? And how would the software help a user identify the kind of metal in the sample?
Is this a question? Click here to post it to the Questions page.
Reply to this comment...
Log in to comment
Hi Jeff-- My knowledge of smart phones apps and anything web based is just about zero. I am aware that these things exist. That is about it.
With that disclaimer, I see no reason that the instrument could not communicate with the web. While our potentiostat is currently tethered to a laptop via a micro-USB cable, I suspect that you are more interested in remote sensing applications where the instrument is powered by a battery and communicates wirelessly. I am sure that can be done but it is outside of my experience. I know that a number of shields exist for wireless / blue tooth / zigbee communications with the LaunchPad. I see no reason why the data could not be transmitted (as serial data?) using one of these to a nearby computer that could transfer it to the web. We wrote the GUI using Processing and the book I use, Learning Processing by Shiffman (good book by the way), says that you can export web applets written in this program. Perhaps I can convince a student to work on this point this spring.
As far as identifying metals goes, to some extent, the metal can be identified by the voltage at which it undergoes electron transfer. I say "to some extent" because other things in solution can bind the metal and shift the measured voltage one way or the other. The most common way to assure yourself that you know the identity of the metal is to make the measurement, spike your sample with the metal you suspect and measure again. If it is the metal you thought, the signal will grow. The amount by which it grows gives you a good measure of the concentration of the metal. Hope that answered your question. Jack
Is this a question? Click here to post it to the Questions page.
Reply to this comment...
Log in to comment
Hi, Jack - well, maybe I'm looking too far forward here. A laptop running a Processing app sounds great.
Is there a kind of listing of graphs of common metals which might be included with the potentiostat as references, or markers in the interface indicating where to look some feature in the graph, like a spike or trough?
Is this a question? Click here to post it to the Questions page.
Reply to this comment...
Log in to comment
Login to comment.