Spectral Workbench usage
This page covers basic usage of the Spectral Workbench software.
Configuring your webcam
You can skip this step, but it may be harder to compare baseline readings. Most webcams have auto exposure and color "correction" so that in dim light, you can still see. This will unfortunately change the exposure between readings, so for quantitative work, it must be disabled. On Linux, you can use the "uvcdynctl" utility as outlined here.
On a Mac, you can download this utility: http://www.phoboslab.org/log/2009/07/uvc-camera-control-for-mac-os-x
Launching the application
Once you have downloaded the software, you should be able to open the "application.macosx" folder and double click spectral_workbench.
Mac: First you will be prompted to select a camera. Choose the webcam associated with your spectrometer, which may be "Creative Webcam Live ..." if you bought the video spectrometer kit. Select "None" under Compression.
Linux users may experience trouble if they do not have a built-in webcam; if you are comfortable coding you can change the line "new Video(x,x,x,1);" to "new Video(x,x,x,0);" which will select the first camera, not the second one.
Basics
The software has 3 "modes" -- Setup, Analyze, and Heatmap. Setup lets you properly configure your spectrometer before using it. Analyze is the main mode you'll be using when testing samples. Heatmap uses a color gradient to display finer differences in your spectra, and is otherwise the same as Analyze.
Setup
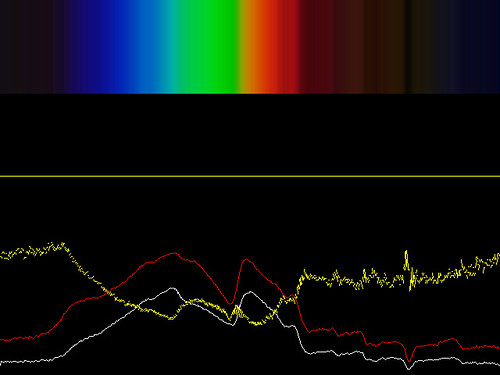
Click the "Setup" tab at the top. You will see a small "preview" window indicating the height of the sampling row. The yellow rectangle is currently not functional so you will have to use the UP and DOWN arrow keys to select the area you'd like to sample from.
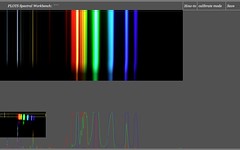
This is a chance to adjust the amount of light you're using as your source. If you have a dimmer, turn the dial until the red, green, and blue intensity curves are full height, but not "hitting the ceiling" -- which would mean you were losing data due to overexposure.
(see plans for improvement)
Store a baseline reading
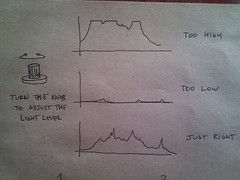
Now that your spectrometer is set up correctly, you can store a "baseline" reading of just your sample container with no sample material. Place your sample container between the light and your spectrometer and press the spacebar. The spectrum you were seeing should be "saved" as a red line which persists even if you remove the sample container.
Measuring a sample
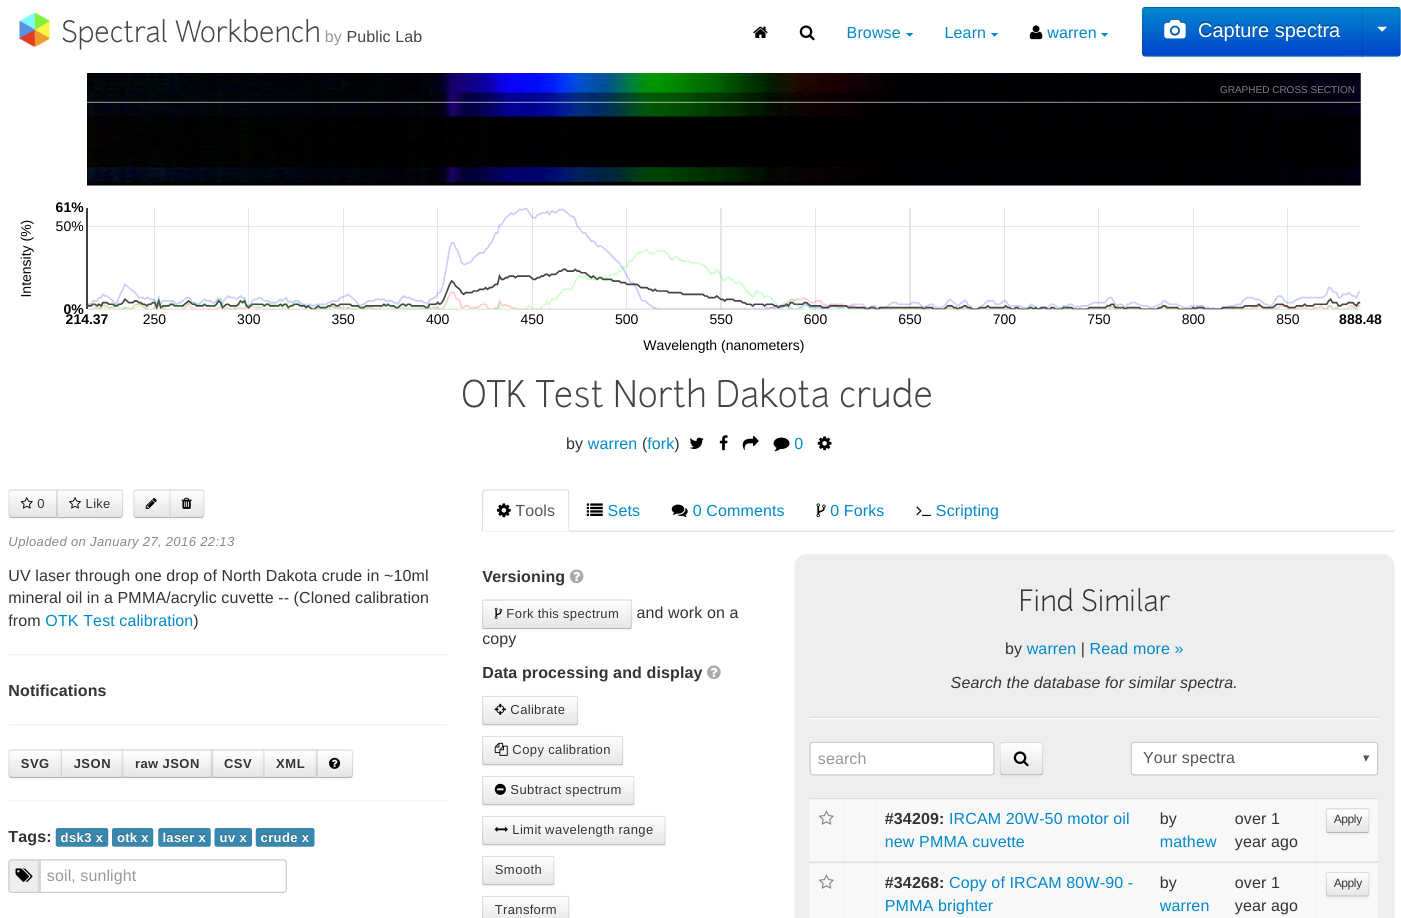
Now place the sample in its container in front of the spectrometer. You should see the white line drop below the red line - this is because your sample is absorbing some of the light. A new, yellow line will appear, representing the amount of absorption.
Saving a spectrum
Before saving, name your spectra by typing a name. It will appear in the top bar. Press "Save". For now, the "Save" function is not working properly, and you must open the "spectra" folder which you will find in the same folder as your application. There you will find any spectra which you have saved. You must edit the uploaded spectra and replace the incorrect data with the data from this folder. (read about this bug here)