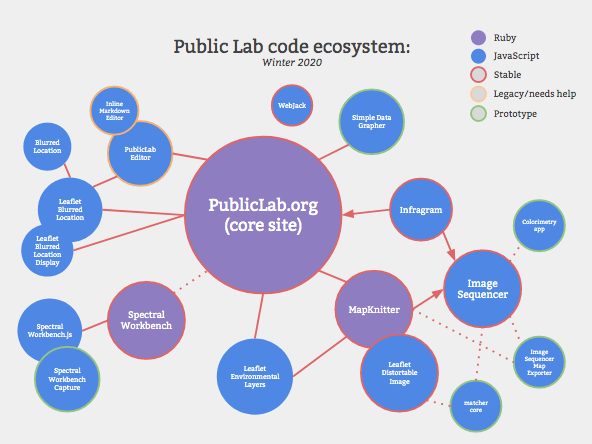
Software overview
Public Lab's software systems include several complete web applications (PublicLab.org, SpectralWorkbench.org, and MapKnitter.org), as well as smaller stand-alone services (Infragram.org, sequencer.publiclab.org) and a variety of small libraries, utilities, and demos (Leaflet.DistortableImage, PublicLab.Editor, and many more).
At the end of this document, find and ask Frequently Asked Questions
(This overview was compiled in Oct/Nov 2020 by @warren with help from @sashadev-sky and @liz.)
The central project is PublicLab.org and its "satellite" projects and utilities like the Editor. Others (MapKnitter, Spectral Workbench, Infragram) are in direct support of kits or projects, while many of the remaining projects listed above are lower-level infrastructural or utility projects, ranging from tools for blurring location data for privacy to collecting and organizing map layers, to cloud-based exporting services. Together these websites, tools, and services provide support in many ways and at many levels to the Public Lab community science network, the Public Lab staff, and the Kits initiative.
PublicLab.org
https://github.com/publiclab/plots2
Overview: The content management system for the Public Lab research community, plots2 hosts a collection of forum-like groups of people, posts, and wiki pages, each focused on a topic like water-quality or disaster-response. (Read about the data model here.) It includes a variety of features that help the Public Lab community collaborate on environmental activism, research, technology design and documentation, as well as community organizing. Originally a Drupal site, it was rewritten in 2012 in Ruby on Rails. The code is organized and structured around inclusive and welcoming community values, as part of our efforts to ensure that historically excluded groups are centered and supported in the crafting of this software project.
Audience/accessibility: designed for a general audience, no particular familiarity with web conventions assumed, prioritize very low barrier interaction - low floor and wide walls over high ceiling.
Usage, costs, contributor community: The Public Lab website served 543k users in the past 12 months and costs ~$670/month, or ~$8k/year to host. 456 contributors from a mix of paid fellows and volunteers have cooperated to build and maintain this software.
Basic workflows:
- People can browse, sign up, follow some topics, post a note, leave a comment.
- More advanced users can create new topics, host discussions and knowledge bases around them, post activities, tutorials and events, and create Q&As.
Key features:
- Rich text authoring environment with image upload for creating posts and wiki pages
- Subscriptions and notifications for followed content
- Dynamic inline collections, maps, and tables using short-code-style inline power tags
- Embeddable interactive listings of activities, posts, questions on external sites
- Geographic tagging of posts and profiles for regional organizing, with location privacy
- A Q&A portal for peer-based problem solving
- Content moderation systems and dashboard for comments and posts
- Print, screen reader, and mobile display accessibility
- Usage statistics system with graphing per-timeframe analytics
- Threaded comments, emoji reactions, and reply-by-email
- OAuth-based login with Twitter, Facebook, GitHub and Google accounts, and OpenID-based unified Single-Sign-On (SSO) for MapKnitter and Spectral Workbench
- Customizable profile pages, posting templates, internationalization, standard API
Goals: This codebase is now primarily moving towards feature stability, as highlighted in our Roadmap, but the next big requested features/systems could include:
- Completing Dashboard overhaul
- Commenting systems overhaul/stabilization
- Additional geographic features work
- Leaflet Environmental Layers UI refinement and stabilization
- Rich wiki editing (project revival)
Maintenance overhead/debt: major drivers of maintenance burden are a deep queue of issues, overall complexity of the codebase, long-term projects like deprecating legacy systems, and feature sprawl, uniqueness and customizability of our platform (pro and con)
Sub-libraries
- PublicLab.Editor: A general purpose, JavaScript/Bootstrap UI framework for rich text posting. An author-friendly, minimal, mobile/desktop interface for creating blog-like content, designed for PublicLab.org. Built on the woofmark markdown/HTML library.
- leaflet-blurred-location: Pop-ups for selecting a "blurred" or low-resolution location, to preserve location privacy.
- leaflet-environmental-layers: A Leaflet map plugin that has a collection of layers containing environmental data pulled in from different sources, with an easy menu for overlaying them in different combinations.
- inline-markdown-editor: a rich editor for long Markdown documents, for our wiki
Infragram
https://github.com/publiclab/infragram
Overview: The Infragram project brings together a range of different efforts to make Do-It-Yourself plant health comparisons possible with infrared photography. It makes processing photographs using the NDVI imaging technique into a simple web-based process instead of one which requires less accessible scientific software. This project was made possible with support from Google and the AREN Project at NASA.
Audience/accessibility: people with an Infragram-family kit, or interested in viewing images. Classroom use in relation to the NASA AREN project. Wetlands researchers.
Which kits use it: Infragram kit family: hacked cameras, Raspberry Pi cameras, webcams
Topics: water-quality, agriculture, wetlands
Usage, costs, contributor community: ~6k users per year, no cost (due to development of "standalone" edition). ~10 contributors from a mix of paid fellows and volunteers have cooperated to build and maintain this software.
Basic workflows:
- Basic: Take a photo with an Infragram camera, visit infragram.org, upload the image, choose a filter color (red or blue) for NDVI processing, choose a colormap, download or save to PublicLab.org.
- Live video: infragram is running on a Raspberry Pi kit and users log into it remotely over WiFi, see NDVI live.
Key features include:
- NDVI processing of uploaded images
- Colormapping of NDVI result images
- Tweaking of NDVI algorithm or use of alternative algorithms such as EVA
- Runs on a Raspberry Pi as part of an Infragram Pi camera
- WebGL-accelerated live video NDVI streaming
- Runs "standalone" without a server (for flexibility and cost savings)
- Relies on PublicLab.org for image saving and social/discussion features
Goals (requested features / stretch goals):
- Simplification and refinement of toolbar UI
- Improved styling/display on mobile devices
- Improved "landing/welcome" onto PublicLab.org platform upon saving images
Maintenance overhead/debt: minimal: needs some webcam API updates.
Sub-libraries/satellites:
- Image Sequencer (see below) - pure-JavaScript, web-based, step-by-step image processing. This helps to understand exactly what steps have been applied to an image during Infragram use, and has been integrated such that the real-time Infragram process can be "exported" to Image Sequencer, which is not as high-speed, but easier to understand and document procedurally.
- Pi Builder - preloaded Raspberry Pi camera software: allows for efficient pre-installation of stand-alone PL software (like Infragram, Image Sequencer, spectral-workbench.js) on Raspberry Pi SD cards for distribution in PL kits. This allows for (as one example) a plug-and-play Infragram camera kit with no coding necessary.
Image Sequencer
https://github.com/publiclab/image-sequencer
Overview: Image Sequencer is different from other image processing systems because it's non-destructive: instead of modifying the original image, it creates a new image at each step in a sequence. Image Sequencer plays an important utility-level role in various Public Lab tools and kits, but it is also architected from the ground up to be easy to contribute to for newcomers, and has an equivalently high rate of newcomer contribution and overall community size and growth trajectory. Very high retention of volunteer contributors.
Audience/accessibility: Educators, students, Infragram/NDVI DIY community, casual users looking for browser or phone-based image processing, NodeJS developers seeking a pure-JavaScript image library, people removing lens distortion from images.
Which kits use it: Infragram, Pi camera
Topics: same as Infragram
Usage, costs, contributor community: Unknown usage as we don't track, and it's a utility library, no hosting cost (purely browser-based). 100+ contributors from a mix of paid fellows and volunteers have cooperated to build and maintain this software.
Basic workflows: Upload an image, select a module and Apply it, repeat for any number of modules, download final image. Drag new images into top of sequence to run the same steps on them. Share the URL to enable other people to use the same sequence.
Key features:
- produces a legible trail of operations, to "show your work" for evidential, educational, or reproducibility reasons
- makes the creation of new tools or "modules" simpler -- each must accept an input image, and produce an output image
- allows many images to run through the same sequence of steps
- works identically in the browser, on Node.js, and on the command line
- cascading changes -- change an earlier step's settings, and see those changes affect later steps
Goals (requested features / stretch goals): improved test coverage, design refinements, bugfixes
Maintenance overhead/debt: Minimal; lots of progress in the past year or so and we are also prototyping a shared community maintenance structure with rotating/overlapping responsibilities
SpectralWorkbench
https://github.com/publiclab/spectral-workbench
Overview: Spectral Workbench is an open-source tool to perform low-cost spectral analysis and to share those results online. It consists of a Ruby on Rails web application for publishing, archiving, discussing, and analyzing spectra online -- running at https://spectralworkbench.org
The core library for analyzing and manipulating spectral data has been spun out into its own self-contained JavaScript module; see below.
Audience/accessibility: People using DIY spectrometers (largely from Public Lab kits) for data collection, education, materials comparisons. These tend to be very high familiarity with web systems, but this is likely self-fulfilling as accessibility issues may present a barrier to others. That said, unlike popular platforms like Raspberry Pi or Arduino, it requires no coding to use and is a fully browser-based user interface.
Which kits use it: Spectrometry kits, esp Lego spectrometer and Papercraft spectrometer
Topics: spectrometry, water-quality, agriculture, air-quality
Usage, costs, contributor community: This website served 50k users in the past 12 months, and has helped 20k users to upload and analyze 180k spectra from DIY spectrometers since ~2011. It costs ~$180/month, or ~$2k/year to host. ~30 contributors from a mix of paid fellows and volunteers have cooperated to build and maintain this software. A standalone, browser-only version is in development which could eliminate hosting costs if needed (see spectral-workbench.js below).
Basic workflows: Build spectrometer, plug it in via USB cable (or attach to phone with tape), visit SpectralWorkbench.org, click Capture spectra, configure camera, begin recording spectrum. Point at a fluorescent bulb and save, follow calibration sequence. Return to Capture page to use calibrated spectrometer. Clean and process saved spectra, compare spectra by collecting them in a set. Embed them on another site to share. Alternatively: upload saved images of spectra to bypass live capture.
Key features:
- Interface with USB webcam, Raspberry Pi, or smartphone DIY spectrometers
- Plot color spectrum video or image on an intensity/color chart
- UI for wavelength calibration of a spectrometer
- Collect spectra into "sets" for comparison
- Search for similar spectra
- "Clean" and analyze data with smoothing and other tools known as "Operations"
- Version tracking of modified data using the "Snapshots" system
Goals (requested features / stretch goals):
- Better smartphone camera compatibility (browser, resolution, facing direction)
- Ability to run stand-alone (reduce dependency on SpectralWorkbench.org application) - see spectral-workbench.js, below
Maintenance overhead/debt:
- Relatively low maintenance; app is stable and reliable
- Lots of old code; significant progress made in summer 2020 to refactor; integration of new code remains. This will likely become more urgent gradually over the next ~2 years.
Sub-libraries/satellites:
- spectral-workbench.js - https://github.com/publiclab/spectral-workbench.js (standalone JavaScript library): the JavaScript heart of Spectral Workbench; a Public Lab project to record, manipulate, and analyze spectrometric data.
- This sub-library contains the bulk of the interactive features of the main SpectralWorkbench.org website, but without the database or search features. This means it can be run without an internet connection, or on a Raspberry Pi, without relying on a server. But key components are still integrated into the "parent" application at SpectralWorkbench.org, preserving a common code base. Long term, this sub-library presents an opportunity to shut down or otherwise migrate the database and associated ~$180/m cost if Public Lab chose to do so.
MapKnitter
https://github.com/publiclab/mapknitter
Overview: MapKnitter is a free and open source tool for combining aerial images into a map, or composite image. Informally, we call this "stitching a map" and it's useful if you have many images of overlapping or identical areas, and getting either a web map or a printable map from your photos. Made possible with development funding from Google's Office of Open Source, MapKnitter is now in its 3rd major version, but it dates back to before Public Lab existed and is our longest-running piece of software. The origins of MapKnitter and it's unique design choices is documented in Jeffrey Yoo Warren's master's thesis.
Audience/accessibility: Non-GIS specialists who have aerial photos and want to create a flat digital or print map from them.
Which kits use it: Balloon mapping, kite mapping, Pole mapping
Topics: water-quality, disaster-response, oil-and-gas, agriculture, wetlands
Usage, costs, contributor community: This website served 14-19k users per year since 2010, and has helped over 3400 people to make more than 6500 maps . It costs ~$500/month, or ~$6k/year to host. ~80-150 contributors from a mix of paid fellows and volunteers have cooperated to build and maintain this software. A standalone, browser-only version is in development which could eliminate hosting costs if needed (see Leaflet.DistortableImage below).
Key features:
- Upload images in batches
- Place them on a reference map using an interactive (touch-sensitive) rubber-sheeting interface
- Save, embed, and share saved interactive web maps on other websites
- Collaborate on maps with others
- Export maps as high-resolution JPG and TIFF images
Goals (requested features / stretch goals):
- Auto-stitching of nearby images while dragging
- Possible stand-alone library capable of producing save-able stitched maps
- Closer integration with PublicLab.org
- Full JavaScript-based cloud exporter, standalone version for local exporting
Maintenance overhead/debt:
- Cloud export maintenance and optimization
- Refined admin/spam moderation systems and integration with PublicLab.org
Sub-libraries/satellites:
- leaflet-environmental-layers: A Leaflet map plugin that has a collection of layers containing environmental data pulled in from different sources, with an easy menu for overlaying them in different combinations. (36 contributors)
Leaflet.DistortableImage
https://github.com/publiclab/mapknitter
Overview: A Leaflet library for rubber-sheeting aerial images onto maps; the heart of MapKnitter's interactive tool without the underlying database or image upload and storage. As a self-contained library, it's reusable by other projects and some development cost/capacity is shared with other orgs as a result. Integrated into MapKnitter web application.
Audience/accessibility: Developers comfortable with JavaScript; this is a utility for larger mapping applications.
Which kits use it: Same as MapKnitter
Topics: Same as MapKnitter
Usage, costs, contributor community: Shares user base with MapKnitter, no cost, 70+ contributors (subset of MapKnitter)
Key features:
- Drag, distort, resize, and rotate images with a mouse or touchscreen; generate single-image distorted downloads in JPG, transparency and outlining for ease of stitching. Rough auto-placement via GPS EXIF tags.
Goals (requested features / stretch goals): Better integration/fixes for GPS EXIF tag reading, ability to queue cloud exports without MapKnitter, ability to run offline from an SD card.
Maintenance overhead/debt: Minimal.
Questions
| Title | Author | Updated | Likes | Comments |
|---|---|---|---|---|
| Nothing yet on the topic "software-overview" -- be the first to post something! |