Revisions for Infragram
| 122 | liz |
May 18, 2013 02:29
| almost 11 years ago
"The Infra-whatnow?"The Infragram is a simple, affordable infrared camera platform -- developed collaboratively, by the Public Lab community -- for measuring plant health and geeking out on gardening. It's for home gardeners, hikers, makers, farmers, amateur scientists, teachers, artists, and anyone curious about the secret lives of plants!
It was originally developed to assess damage to wetlands in the wake of the BP oil spill; but it's also a simple, easy-to-modify, open-source hardware and software tool that anyone who's curious about plant physiology and health can use. Vineyards, large farms, and NASA all use near-infrared photography for assessment, usually by mounting expensive sensors on airplanes and satellites. Infragram brings this technology to average citizens, enabling them to monitor their environment through quantifiable, citizen-generated data. Just as photography was instrumental to the rise of credible print journalism, DIY data collection technologies like Infragram democratize and improve reporting about environmental impacts. By creating a low-cost camera and working with farmers and environmental activists, we hope to explore grassroots uses for this kind of technology. What could farmers or activists do with leaf-scale, plant-scale, lot-scale, and field-scale data on plant health if the equipment costs as little as $10 or $35? What you get:
The final configuration will depend on the # of backers, but it will likely use AAA batteries and use a micro SD card. We're promising a minimum of 2 megapixel resolution, but should be able to do much better, especially if we get a lot of backers. Basically, the more money we raise, the better these cameras will get!
"The name "Infragram" comes from Infrared Photogrammetry, the use of photography to create spacialized and quantified data. When NASA started using this technique on the Landsat satellites in the 1970's and 80's, each camera was custom-built for the purpose. Now, consumer cameras are so advanced that even a five year old point and shoot can generate excellent data with nothing more than a change of the filters and calibration through the Infragram site."-- Mathew Lippincott, Public Lab "We're excited that Public Laboratory is developing a low-cost infrared camera which will help us track the success of wetland restoration projects in the Gulf Region--as well as help us track pollution. The Gulf Restoration Network has been using the aerial monitoring techniques that Public Lab developed, so having the infrared camera available to put on the balloon and kite rig will only expand the applications of that technology as well as add value to airplane monitoring flights that help us watchdog the oil industry in the Gulf." -- Scott Eustis, M.S., Gulf Restoration Network More informationThe Public Lab community has been building up a knowledge base in DIY infrared imaging for years. To join in, start here:
|
Revert | |
| 121 | liz |
May 18, 2013 02:27
| almost 11 years ago
"The Infra-whatnow?"The Infragram is a simple, affordable infrared camera platform -- developed collaboratively, by the Public Lab community -- for measuring plant health and geeking out on gardening. It's for home gardeners, hikers, makers, farmers, amateur scientists, teachers, artists, and anyone curious about the secret lives of plants!
It was originally developed to assess damage to wetlands in the wake of the BP oil spill; but it's also a simple, easy-to-modify, open-source hardware and software tool that anyone who's curious about plant physiology and health can use. Vineyards, large farms, and NASA all use near-infrared photography for assessment, usually by mounting expensive sensors on airplanes and satellites. Infragram brings this technology to average citizens, enabling them to monitor their environment through quantifiable, citizen-generated data. Just as photography was instrumental to the rise of credible print journalism, DIY data collection technologies like Infragram democratize and improve reporting about environmental impacts. By creating a low-cost camera and working with farmers and environmental activists, we hope to explore grassroots uses for this kind of technology. What could farmers or activists do with leaf-scale, plant-scale, lot-scale, and field-scale data on plant health if the equipment costs as little as $10 or $35? What you get:
The final configuration will depend on the # of backers, but it will likely use AAA batteries and use a micro SD card. We're promising a minimum of 2 megapixel resolution, but should be able to do much better, especially if we get a lot of backers. Basically, the more money we raise, the better these cameras will get!
"The name "Infragram" comes from Infrared Photogrammetry, the use of photography to create spacialized and quantified data. When NASA started using this technique on the Landsat satellites in the 1970's and 80's, each camera was custom-built for the purpose. Now, consumer cameras are so advanced that even a five year old point and shoot can generate excellent data with nothing more than a change of the filters and calibration through the Infragram site."-- Mathew Lippincott, Public Lab "We're excited that Public Laboratory is developing a low-cost infrared camera which will help us track the success of wetland restoration projects in the Gulf Region--as well as help us track pollution. The Gulf Restoration Network has been using the aerial monitoring techniques that Public Lab developed, so having the infrared camera available to put on the balloon and kite rig will only expand the applications of that technology as well as add value to airplane monitoring flights that help us watchdog the oil industry in the Gulf." -- Scott Eustis, M.S., Gulf Restoration Network More informationThe Public Lab community has been building up a knowledge base in DIY infrared imaging for years. To join in, start here:
|
Revert | |
| 120 | liz |
May 18, 2013 02:26
| almost 11 years ago
"The Infra-whatnow?"The Infragram is a simple, affordable infrared camera platform -- developed collaboratively, by the Public Lab community -- for measuring plant health and geeking out on gardening. It's for home gardeners, hikers, makers, farmers, amateur scientists, teachers, artists, and anyone curious about the secret lives of plants!
It was originally developed to assess damage to wetlands in the wake of the BP oil spill; but it's also a simple, easy-to-modify, open-source hardware and software tool that anyone who's curious about plant physiology and health can use. Vineyards, large farms, and NASA all use near-infrared photography for assessment, usually by mounting expensive sensors on airplanes and satellites. Infragram brings this technology to average citizens, enabling them to monitor their environment through quantifiable, citizen-generated data. Just as photography was instrumental to the rise of credible print journalism, DIY data collection technologies like Infragram democratize and improve reporting about environmental impacts. By creating a low-cost camera and working with farmers and environmental activists, we hope to explore grassroots uses for this kind of technology. What could farmers or activists do with leaf-scale, plant-scale, lot-scale, and field-scale data on plant health if the equipment costs as little as $10 or $35? What you get:
The final configuration will depend on the # of backers, but it will likely use AAA batteries and use a micro SD card. We're promising a minimum of 2 megapixel resolution, but should be able to do much better, especially if we get a lot of backers. Basically, the more money we raise, the better these cameras will get!
???The name "Infragram" comes from Infrared Photogrammetry, the use of photography to create spacialized and quantified data. When NASA started using this technique on the Landsat satellites in the 1970???s and 80???s, each camera was custom-built for the purpose. Now, consumer cameras are so advanced that even a five year old point and shoot can generate excellent data with nothing more than a change of the filters and calibration through the Infragram site.???-- Mathew Lippincott, Public Lab ???We???re excited that Public Laboratory is developing a low-cost infrared camera which will help us track the success of wetland restoration projects in the Gulf Region--as well as help us track pollution. The Gulf Restoration Network has been using the aerial monitoring techniques that Public Lab developed, so having the infrared camera available to put on the balloon and kite rig will only expand the applications of that technology as well as add value to airplane monitoring flights that help us watchdog the oil industry in the Gulf.??? -- Scott Eustis, M.S., Gulf Restoration Network More informationThe Public Lab community has been building up a knowledge base in DIY infrared imaging for years. To join in, start here:
|
Revert | |
| 119 | liz |
May 18, 2013 02:08
| almost 11 years ago
"The Infra-whatnow?"The Infragram is a simple, affordable infrared camera platform -- developed collaboratively, by the Public Lab community -- for measuring plant health and geeking out on gardening. It's for home gardeners, hikers, makers, farmers, amateur scientists, teachers, artists, and anyone curious about the secret lives of plants!
It was originally developed to assess damage to wetlands in the wake of the BP oil spill; but it's also a simple, easy-to-modify, open-source hardware and software tool that anyone who's curious about plant physiology and health can use. Vineyards, large farms, and NASA all use near-infrared photography for assessment, usually by mounting expensive sensors on airplanes and satellites. Infragram brings this technology to average citizens, enabling them to monitor their environment through quantifiable, citizen-generated data. Just as photography was instrumental to the rise of credible print journalism, DIY data collection technologies like Infragram democratize and improve reporting about environmental impacts. By creating a low-cost camera and working with farmers and environmental activists, we hope to explore grassroots uses for this kind of technology. What could farmers or activists do with leaf-scale, plant-scale, lot-scale, and field-scale data on plant health if the equipment costs as little as $10 or $35? What you get:
The final configuration will depend on the # of backers, but it will likely use AAA batteries and use a micro SD card. We're promising a minimum of 2 megapixel resolution, but should be able to do much better, especially if we get a lot of backers. Basically, the more money we raise, the better these cameras will get!
More informationThe Public Lab community has been building up a knowledge base in DIY infrared imaging for years. To join in, start here:
|
Revert | |
| 118 | warren |
May 17, 2013 22:33
| almost 11 years ago
"The Infra-whatnow?"The Infragram is a simple, affordable infrared camera platform -- developed collaboratively, by the Public Lab community -- for measuring plant health and geeking out on gardening. It's for home gardeners, hikers, makers, farmers, amateur scientists, teachers, artists, and anyone curious about the secret lives of plants!
It was originally developed to assess damage to wetlands in the wake of the BP oil spill; but it's also a simple, easy-to-modify, open-source hardware and software tool that anyone who's curious about plant physiology and health can use. Vineyards, large farms, and NASA all use near-infrared photography for assessment, usually by mounting expensive sensors on airplanes and satellites. Infragram brings this technology to average citizens, enabling them to monitor their environment through quantifiable, citizen-generated data. Just as photography was instrumental to the rise of credible print journalism, DIY data collection technologies like Infragram democratize and improve reporting about environmental impacts. By creating a low-cost camera and working with farmers and environmental activists, we hope to explore grassroots uses for this kind of technology. What could farmers or activists do with leaf-scale, plant-scale, lot-scale, and field-scale data on plant health if the equipment costs as little as $10 or $35? The images below depict other prototypes that were created by our community over the years. If you are interested in the story of how this project got started, check out our early prototypes and experiments on this page: http://publiclab.org/wiki/near-infrared-camera-history.
|
Revert | |
| 117 | warren |
May 17, 2013 22:31
| almost 11 years ago
"The Infra-whatnow?"The Infragram is a simple, affordable infrared camera platform -- developed collaboratively, by the Public Lab community -- for measuring plant health and geeking out on gardening. It's for home gardeners, hikers, makers, farmers, amateur scientists, teachers, artists, and anyone curious about the secret lives of plants!
It was originally developed to assess damage to wetlands in the wake of the BP oil spill; but it's also a simple, easy-to-modify, open-source hardware and software tool that anyone who's curious about plant physiology and health can use. What is it good for?
Vineyards, large farms, and NASA all use near-infrared photography for assessment, usually by mounting expensive sensors on airplanes and satellites. Infragram brings this technology to average citizens, enabling them to monitor their environment through quantifiable, citizen-generated data. Just as photography was instrumental to the rise of credible print journalism, DIY data collection technologies like Infragram democratize and improve reporting about environmental impacts. By creating a low-cost camera and working with farmers and environmental activists, we hope to explore grassroots uses for this kind of technology. What could farmers or activists do with leaf-scale, plant-scale, lot-scale, and field-scale data on plant health if the equipment costs as little as $10 or $35? The images below depict other prototypes that were created by our community over the years. If you are interested in the story of how this project got started, check out our early prototypes and experiments on this page: http://publiclab.org/wiki/near-infrared-camera-history.
|
Revert | |
| 116 | warren |
May 17, 2013 22:27
| almost 11 years ago
"The Infra-whatnow?"The Infragram is a simple, affordable infrared camera platform -- developed collaboratively, by the Public Lab community -- for measuring plant health and geeking out on gardening. It's for home gardeners, hikers, makers, farmers, amateur scientists, teachers, artists, and anyone curious about the secret lives of plants!
It was originally developed to assess damage to wetlands in the wake of the BP oil spill; but it's also a simple, easy-to-modify, open-source hardware and software tool that anyone who's curious about plant physiology and health can use. What is it good for?
Vineyards, large farms, and NASA all use near-infrared photography for assessment, usually by mounting expensive sensors on airplanes and satellites. Infragram brings this technology to average citizens, enabling them to monitor their environment through quantifiable, citizen-generated data. Just as photography was instrumental to the rise of credible print journalism, DIY data collection technologies like Infragram democratize and improve reporting about environmental impacts. By creating a low-cost camera and working with farmers and environmental activists, we hope to explore grassroots uses for this kind of technology. What could farmers or activists do with leaf-scale, plant-scale, lot-scale, and field-scale data on plant health if the equipment costs as little as $10 or $35? The images below depict other prototypes that were created by our community over the years. If you are interested in the story of how this project got started, check out our early prototypes and experiments on this page: http://publiclab.org/wiki/near-infrared-camera-history.
|
Revert | |
| 115 | liz |
May 17, 2013 21:10
| almost 11 years ago
"The Infra-whatnow?"The Infragram is a simple, affordable infrared camera platform -- developed collaboratively, by the Public Lab community -- for measuring plant health and geeking out on gardening. It's for home gardeners, hikers, makers, farmers, amateur scientists, teachers, artists, and anyone curious about the secret lives of plants!
It was originally developed to assess damage to wetlands in the wake of the BP oil spill; but it's also a simple, easy-to-modify, open-source hardware and software tool that anyone who's curious about plant physiology and health can use. What is it good for?
Vineyards, large farms, and NASA all use near-infrared photography for assessment, usually by mounting expensive sensors on airplanes and satellites. Infragram brings this technology to average citizens, enabling them to monitor their environment through quantifiable, citizen-generated data. Just as photography was instrumental to the rise of credible print journalism, DIY data collection technologies like Infragram democratize and improve reporting about environmental impacts. Remote infrared imagingThe study of Earth's environment from space got its start in 1972 when the first Landsat satellite was launched. The multispectral scanner it carried, like the scanners on all subsequent Landsat satellites, recorded images with both visible and near infrared light. Remote sensing scientists quickly learned that by combining visible and infrared data, they could reveal critical information about the health of vegetation. For example, the normalized difference vegetation index (NDVI) highlights the difference between the red and infrared wavelengths that are reflected from vegetation. Because red light is used by plants for photosynthesis but infrared light is not, NDVI allows scientists to estimate the amount of healthy foliage in every satellite image. Thousands of scientists, including landscape ecologists, global change biologists, and habitat specialists have relied on these valuable satellite-based NDVI images for decades. Up-close infrared imagingThe goal of the Infragram project is to bring the power of NDVI and other infrared vegetation images back to earth where everyone can now take close-up images of plants or landscapes and instantly learn about their health and vigor. There are public sources of infrared photography for the US available through the Department of Agriculture -- NAIP and Vegscape -- but this imagery is not collected when, as often, or at useable scale for individuals who are managing small plots. By creating a low-cost camera and working with farmers and environmental activists, we hope to explore grassroots uses for this kind of technology. What could farmers or activists do with leaf-scale, plant-scale, lot-scale, and field-scale data on plant health if the equipment costs as little as $10 or $35?
Screenshot from 2011-09-10-colorado-boulder-foothills-community-park-NRG. See how clearly plants are identifiable from bare earth or pavement. The unique colors in this photo will be explained below, keep reading! Why does it work? (quick science)Though we cannot perceive it with our eyes, everything around us (including plants) reflects and absorbs wavelengths of light in red, green, blue and beyond into infrared, ultraviolet, and more. Our colorful world is created by varying amounts of particular wavelengths being absorbed and reflected. This also means that everything has a recognizable "spectral signature". Whoa. Let's focus on plants:
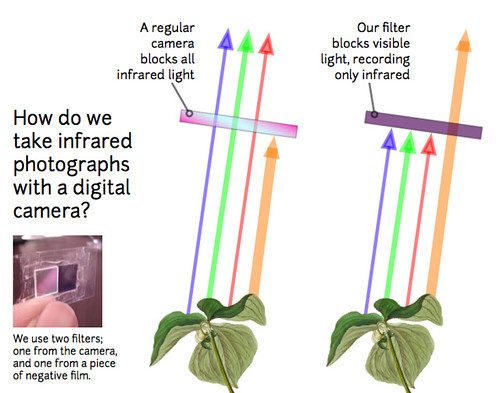
Plants use visible light (mainly blue and red light) as 'food' -- but not so much green light, which is why they reflect more green light away, and thus look green to our eyes. They also happen to reflect a lot of near infrared light (which is just beyond red light, but not visible to the human eye). This is because they chemically cannot convert infrared into usable food, and so they just bounce all of it away to stay cool. The illustrations show what colors of light plants absorb versus reflect away. By using this unique property of plants, plus our ability to take near-infrared photos we can create composite images which highlight where plants are and how much they are photosynthesizing. To composite these four bands of information (infrared, red, green, blue) into the three bands that our eyes can see (red, green, and blue), we have to get creative. We drop the information that is normally contained in the red band, and use it to draw near-infrared:
By using this method of re-writing what information is contained in the red-green-bllue images that our eyes can see, we can make images that depict how actively plants are photosynthesizing:
Figure above: Normal color photo (top) and normalized difference vegetation index (NDVI) image. NDVI image was derived from two color channels in a single photo taken with a camera modified with a special infrared filter. Note that tree trunks, brown grass, and rocks have very low NDVI values because they are not photosynthetic. Healthy plants typically have NDVI values between 0.1 and 0.9.
How do we do it? (prototypes, links)The Public Lab community has been hacking cheap digital cameras for years. There are many different versions now, and we're offering our favorites as rewards for Kickstarter backers. For all these models, this campaign is our opportunity to go in together and make a bulk order so that we all get the biggest bang for our buck.
The images below depict other prototypes that were created by our community over the years. If you are interested in the story of how this project got started, check out our early prototypes and experiments on this page: http://publiclab.org/wiki/near-infrared-camera-history.
|
Revert | |
| 114 | liz |
May 17, 2013 20:06
| almost 11 years ago
"The Infra-whatnow?"The Infragram is a simple, affordable infrared camera platform -- developed collaboratively, by the Public Lab community -- for measuring plant health and geeking out on gardening. It's for farmers, gardeners, DIY scientists, hikers, makers, farmers, teachers, kids, artists, and you!
It was originally developed to assess damage to wetlands in the wake of the BP oil spill; but it's also a simple, easy-to-modify, open-source hardware and software tool that anyone who's curious about plant physiology and health can use. What is it good for?
Vineyards, large farms, and NASA all use near-infrared photography for assessment, usually by mounting expensive sensors on airplanes and satellites. Infragram brings this technology to average citizens, enabling them to monitor their environment through quantifiable, citizen-generated data. Just as photography was instrumental to the rise of credible print journalism, DIY data collection technologies like Infragram democratize and improve reporting about environmental impacts. Remote infrared imagingThe study of Earth's environment from space got its start in 1972 when the first Landsat satellite was launched. The multispectral scanner it carried, like the scanners on all subsequent Landsat satellites, recorded images with both visible and near infrared light. Remote sensing scientists quickly learned that by combining visible and infrared data, they could reveal critical information about the health of vegetation. For example, the normalized difference vegetation index (NDVI) highlights the difference between the red and infrared wavelengths that are reflected from vegetation. Because red light is used by plants for photosynthesis but infrared light is not, NDVI allows scientists to estimate the amount of healthy foliage in every satellite image. Thousands of scientists, including landscape ecologists, global change biologists, and habitat specialists have relied on these valuable satellite-based NDVI images for decades. Up-close infrared imagingThe goal of the Infragram project is to bring the power of NDVI and other infrared vegetation images back to earth where everyone can now take close-up images of plants or landscapes and instantly learn about their health and vigor. There are public sources of infrared photography for the US available through the Department of Agriculture -- NAIP and Vegscape -- but this imagery is not collected when, as often, or at useable scale for individuals who are managing small plots. By creating a low-cost camera and working with farmers and environmental activists, we hope to explore grassroots uses for this kind of technology. What could farmers or activists do with leaf-scale, plant-scale, lot-scale, and field-scale data on plant health if the equipment costs as little as $10 or $35?
Screenshot from 2011-09-10-colorado-boulder-foothills-community-park-NRG. See how clearly plants are identifiable from bare earth or pavement. The unique colors in this photo will be explained below, keep reading! Why does it work? (quick science)Though we cannot perceive it with our eyes, everything around us (including plants) reflects and absorbs wavelengths of light in red, green, blue and beyond into infrared, ultraviolet, and more. Our colorful world is created by varying amounts of particular wavelengths being absorbed and reflected. This also means that everything has a recognizable "spectral signature". Whoa. Let's focus on plants:
Plants use visible light (mainly blue and red light) as 'food' -- but not so much green light, which is why they reflect more green light away, and thus look green to our eyes. They also happen to reflect a lot of near infrared light (which is just beyond red light, but not visible to the human eye). This is because they chemically cannot convert infrared into usable food, and so they just bounce all of it away to stay cool. The illustrations show what colors of light plants absorb versus reflect away. By using this unique property of plants, plus our ability to take near-infrared photos we can create composite images which highlight where plants are and how much they are photosynthesizing. To composite these four bands of information (infrared, red, green, blue) into the three bands that our eyes can see (red, green, and blue), we have to get creative. We drop the information that is normally contained in the red band, and use it to draw near-infrared:
By using this method of re-writing what information is contained in the red-green-bllue images that our eyes can see, we can make images that depict how actively plants are photosynthesizing:
Figure above: Normal color photo (top) and normalized difference vegetation index (NDVI) image. NDVI image was derived from two color channels in a single photo taken with a camera modified with a special infrared filter. Note that tree trunks, brown grass, and rocks have very low NDVI values because they are not photosynthetic. Healthy plants typically have NDVI values between 0.1 and 0.9.
How do we do it? (prototypes, links)The Public Lab community has been hacking cheap digital cameras for years. There are many different versions now, and we're offering our favorites as rewards for Kickstarter backers. For all these models, this campaign is our opportunity to go in together and make a bulk order so that we all get the biggest bang for our buck.
The images below depict other prototypes that were created by our community over the years. If you are interested in the story of how this project got started, check out our early prototypes and experiments on this page: http://publiclab.org/wiki/near-infrared-camera-history.
|
Revert | |
| 113 | liz |
May 17, 2013 20:02
| almost 11 years ago
"The Infra-whatnow?"The Infragram is a simple, affordable infrared camera platform -- developed collaboratively, by the Public Lab community -- for measuring plant health and geeking out on gardening. It's for farmers, gardeners, DIY scientists, hikers, makers, farmers, teachers, kids, artists, and you!
It was originally developed to assess damage to wetlands in the wake of the BP oil spill; but it's also a simple, easy-to-modify, open-source hardware and software tool that anyone who's curious about plant physiology and health can use. What is it good for?
Vineyards, large farms, and NASA all use near-infrared photography for assessment, usually by mounting expensive sensors on airplanes and satellites. Infragram brings this technology to average citizens, enabling them to monitor their environment through quantifiable, citizen-generated data. Just as photography was instrumental to the rise of credible print journalism, DIY data collection technologies like Infragram democratize and improve reporting about environmental impacts. Remote infrared imagingThe study of Earth's environment from space got its start in 1972 when the first Landsat satellite was launched. The multispectral scanner it carried, like the scanners on all subsequent Landsat satellites, recorded images with both visible and near infrared light. Remote sensing scientists quickly learned that by combining visible and infrared data, they could reveal critical information about the health of vegetation. For example, the normalized difference vegetation index (NDVI) highlights the difference between the red and infrared wavelengths that are reflected from vegetation. Because red light is used by plants for photosynthesis but infrared light is not, NDVI allows scientists to estimate the amount of healthy foliage in every satellite image. Thousands of scientists, including landscape ecologists, global change biologists, and habitat specialists have relied on these valuable satellite-based NDVI images for decades. Up-close infrared imagingThe goal of the Infragram project is to bring the power of NDVI and other infrared vegetation images back to earth where everyone can now take close-up images of plants or landscapes and instantly learn about their health and vigor. There are public sources of infrared photography for the US available through the Department of Agriculture -- NAIP and Vegscape -- but this imagery is not collected when, as often, or at useable scale for individuals who are managing small plots. By creating a low-cost camera and working with farmers and environmental activists, we hope to explore grassroots uses for this kind of technology. What could farmers or activists do with leaf-scale, plant-scale, lot-scale, and field-scale data on plant health if the equipment costs as little as $10 or $35?
Screenshot from 2011-09-10-colorado-boulder-foothills-community-park-NRG. See how clearly plants are identifiable from bare earth or pavement. The unique colors in this photo will be explained below, keep reading! Why does it work? (quick science)Though we cannot perceive it with our eyes, everything around us (including plants) reflects and absorbs wavelengths of light in red, green, blue and beyond into infrared, ultraviolet, and more. Our colorful world is created by varying amounts of particular wavelengths being absorbed and reflected. This also means that everything has a recognizable "spectral signature". Whoa. Let's focus on plants:
Plants use visible light (mainly blue and red light) as 'food' -- but not so much green light, which is why they reflect green away, and thus look green to our eyes. They also happen to reflect near infrared light (which is just beyond red light, but not visible to the human eye). This is because they chemically cannot convert infrared into usable food, and so they just bounce it away to stay cool. The illustrations show what colors of light plants absorb versus reflect away. By using this unique property of plants, plus our ability to take near-infrared photos we can create composite images which highlight where plants are and how much they are photosynthesizing. To composite the four bands of information into the three bands that our eyes can see (red, green, and blue), we have to get creative. We drop the information that is normally contained in the red band, and use it to represent high values of near-infrared:
By using this method of re-writing what information is contained in the red-green-bllue images that our eyes can see, we can make images that depict plant health:
Figure above: Normal color photo (top) and normalized difference vegetation index (NDVI) image. NDVI image was derived from two color channels in a single photo taken with a camera modified with a special infrared filter. Note that tree trunks, brown grass, and rocks have very low NDVI values because they are not photosynthetic. Healthy plants typically have NDVI values between 0.1 and 0.9.
How do we do it? (prototypes, links)The Public Lab community has been hacking cheap digital cameras for years. There are many different versions now, and we're offering our favorites as rewards for Kickstarter backers. For all these models, this campaign is our opportunity to go in together and make a bulk order so that we all get the biggest bang for our buck.
The images below depict other prototypes that were created by our community over the years. If you are interested in the story of how this project got started, check out our early prototypes and experiments on this page: http://publiclab.org/wiki/near-infrared-camera-history.
|
Revert | |
| 112 | liz |
May 17, 2013 19:59
| almost 11 years ago
"The Infra-whatnow?"The Infragram is a simple, affordable infrared camera platform -- developed collaboratively, by the Public Lab community -- for measuring plant health and geeking out on gardening. It's for farmers, gardeners, DIY scientists, hikers, makers, farmers, teachers, kids, artists, and you!
It was originally developed to assess damage to wetlands in the wake of the BP oil spill; but it's also a simple, easy-to-modify, open-source hardware and software tool that anyone who's curious about plant physiology and health can use. What is it good for?
Vineyards, large farms, and NASA all use near-infrared photography for assessment, usually by mounting expensive sensors on airplanes and satellites. Infragram brings this technology to average citizens, enabling them to monitor their environment through quantifiable, citizen-generated data. Just as photography was instrumental to the rise of credible print journalism, DIY data collection technologies like Infragram democratize and improve reporting about environmental impacts. Remote infrared imagingThe study of Earth's environment from space got its start in 1972 when the first Landsat satellite was launched. The multispectral scanner it carried, like the scanners on all subsequent Landsat satellites, recorded images with both visible and near infrared light. Remote sensing scientists quickly learned that by combining visible and infrared data, they could reveal critical information about the health of vegetation. For example, the normalized difference vegetation index (NDVI) highlights the difference between the red and infrared wavelengths that are reflected from vegetation. Because red light is used by plants for photosynthesis but infrared light is not, NDVI allows scientists to estimate the amount of healthy foliage in every satellite image. Thousands of scientists, including landscape ecologists, global change biologists, and habitat specialists have relied on these valuable satellite-based NDVI images for decades. Up-close infrared imagingThe goal of the Infragram project is to bring the power of NDVI and other infrared vegetation images back to earth where everyone can now take close-up images of plants or landscapes and instantly learn about their health and vigor. There are public sources of infrared photography for the US available through the Department of Agriculture -- NAIP and Vegscape -- but this imagery is not collected when, as often, or at useable scale for individuals who are managing small plots. By creating a low-cost camera and working with farmers and environmental activists, we hope to explore grassroots uses for this kind of technology. What could farmers or activists do with leaf-scale, plant-scale, lot-scale, and field-scale data on plant health if the equipment costs as little as $10 or $35?
Screenshot from 2011-09-10-colorado-boulder-foothills-community-park-NRG. See how clearly plants are identifiable from bare earth or pavement. The unique colors in this photo will be explained below, keep reading! Why does it work? (quick science)Though we cannot perceive it with our eyes, everything around us (including plants) reflects and absorbs wavelengths of light in red, green, blue and beyond into infrared, ultraviolet, and more. Our colorful world is created by varying amounts of particular wavelengths being absorbed and reflected. This also means that everything has a recognizable "spectral signature". Whoa. Let's focus on plants:
Plants use visible light (mainly blue and red light) as 'food' -- but not so much green light, which is why they reflect green away, and thus look green to our eyes. They also happen to reflect near infrared light (which is just beyond red light, but not visible to the human eye). This is because they chemically cannot convert infrared into usable food, and so they just bounce it away to stay cool. The illustrations show what colors of light plants absorb versus reflect away. By using this unique property of plants, plus our ability to take near-infrared photos we can create composite images which highlight where plants are and how much they are photosynthesizing.
Figure above: Normal color photo (top) and normalized difference vegetation index (NDVI) image. NDVI image was derived from two color channels in a single photo taken with a camera modified with a special infrared filter. Note that tree trunks, brown grass, and rocks have very low NDVI values because they are not photosynthetic. Healthy plants typically have NDVI values between 0.1 and 0.9.
How do we do it? (prototypes, links)The Public Lab community has been hacking cheap digital cameras for years. There are many different versions now, and we're offering our favorites as rewards for Kickstarter backers. For all these models, this campaign is our opportunity to go in together and make a bulk order so that we all get the biggest bang for our buck.
The images below depict other prototypes that were created by our community over the years. If you are interested in the story of how this project got started, check out our early prototypes and experiments on this page: http://publiclab.org/wiki/near-infrared-camera-history.
|
Revert | |
| 111 | liz |
May 17, 2013 19:17
| almost 11 years ago
"The Infra-whatnow?"The Infragram is a simple, affordable infrared camera platform -- developed collaboratively, by the Public Lab community -- for measuring plant health and geeking out on gardening. It's for farmers, gardeners, DIY scientists, hikers, makers, farmers, teachers, kids, artists, and you!
It was originally developed to assess damage to wetlands in the wake of the BP oil spill; but it's also a simple, easy-to-modify, open-source hardware and software tool that anyone who's curious about plant physiology and health can use. What is it good for?
Vineyards, large farms, and NASA all use near-infrared photography for assessment, usually by mounting expensive sensors on airplanes and satellites. Infragram brings this technology to average citizens, enabling them to monitor their environment through quantifiable, citizen-generated data. Just as photography was instrumental to the rise of credible print journalism, DIY data collection technologies like Infragram democratize and improve reporting about environmental impacts. Remote infrared imagingThe study of Earth's environment from space got its start in 1972 when the first Landsat satellite was launched. The multispectral scanner it carried, like the scanners on all subsequent Landsat satellites, recorded images with both visible and near infrared light. Remote sensing scientists quickly learned that by combining visible and infrared data, they could reveal critical information about the health of vegetation. For example, the normalized difference vegetation index (NDVI) highlights the difference between the red and infrared wavelengths that are reflected from vegetation. Because red light is used by plants for photosynthesis but infrared light is not, NDVI allows scientists to estimate the amount of healthy foliage in every satellite image. Thousands of scientists, including landscape ecologists, global change biologists, and habitat specialists have relied on these valuable satellite-based NDVI images for decades. Up-close infrared imagingThe goal of the Infragram project is to bring the power of NDVI and other infrared vegetation images back to earth where everyone can now take close-up images of plants or landscapes and instantly learn about their health and vigor. There are public sources of infrared photography for the US available through the Department of Agriculture -- NAIP and Vegscape -- but this imagery is not collected when, as often, or at useable scale for individuals who are managing small plots. By creating a low-cost camera and working with farmers and environmental activists, we hope to explore grassroots uses for this kind of technology. What could farmers or activists do with leaf-scale, plant-scale, lot-scale, and field-scale data on plant health if the equipment costs as little as $10 or $35?
Screenshot from 2011-09-10-colorado-boulder-foothills-community-park-NRG. See how clearly plants are identifiable from bare earth or pavement. The unique colors in this photo will be explained below, keep reading! Why does it work? (quick science)Though we cannot perceive it with our eyes, everything around us (including plants) reflects and absorbs wavelengths of light in red, green, blue and beyond into infrared, ultraviolet, and more. Our colorful world is created by varying amounts of particular wavelengths being absorbed and reflected. This also means that everything has a recognizable "spectral signature". Whoa. Let's focus on plants:
Plants use visible light (mainly blue and red light) as 'food' -- but not so much green light, which is why they reflect green away, and thus look green to our eyes. They also happen to reflect near infrared light (which is just beyond red light, but not visible to the human eye). This is because they chemically cannot convert infrared into usable food, and so they just bounce it away to stay cool. The illustrations show what colors of light plants absorb versus reflect away. By using this unique property of plants, plus our ability to take near-infrared photos we can create composite images which highlight where plants are and how much they are photosynthesizing.
Figure above: Normal color photo (top) and normalized difference vegetation index (NDVI) image. NDVI image was derived from two color channels in a single photo taken with a camera modified with a special infrared filter. Note that tree trunks, brown grass, and rocks have very low NDVI values because they are not photosynthetic. Healthy plants typically have NDVI values between 0.1 and 0.9.
How do we do it? (prototypes, links)The Public Lab community has been hacking cheap digital cameras for years. There are many different versions now, and we're offering our favorites as rewards for Kickstarter backers:
For all these rewards, this campaign is our opportunity to go in together and make a bulk order so that we all get the biggest bang for our buck. The images below depict other prototypes that were created by our community over the years. If you are interested in the story of how this project got started, check out our early prototypes and experiments on this page: http://publiclab.org/wiki/near-infrared-camera-history.
|
Revert | |
| 110 | liz |
May 17, 2013 19:15
| almost 11 years ago
"The Infra-whatnow?"The Infragram is a simple, affordable infrared camera platform -- developed collaboratively, by the Public Lab community -- for measuring plant health and geeking out on gardening. It's for farmers, gardeners, DIY scientists, hikers, makers, farmers, teachers, kids, artists, and you!
It was originally developed to assess damage to wetlands in the wake of the BP oil spill; but it's also a simple, easy-to-modify, open-source hardware and software tool that anyone who's curious about plant physiology and health can use. What is it good for?
Vineyards, large farms, and NASA all use near-infrared photography for assessment, usually by mounting expensive sensors on airplanes and satellites. Infragram brings this technology to average citizens, enabling them to monitor their environment through quantifiable, citizen-generated data. Just as photography was instrumental to the rise of credible print journalism, DIY data collection technologies like Infragram democratize and improve reporting about environmental impacts. Remote infrared imagingThe study of Earth's environment from space got its start in 1972 when the first Landsat satellite was launched. The multispectral scanner it carried, like the scanners on all subsequent Landsat satellites, recorded images with both visible and near infrared light. Remote sensing scientists quickly learned that by combining visible and infrared data, they could reveal critical information about the health of vegetation. For example, the normalized difference vegetation index (NDVI) highlights the difference between the red and infrared wavelengths that are reflected from vegetation. Because red light is used by plants for photosynthesis but infrared light is not, NDVI allows scientists to estimate the amount of healthy foliage in every satellite image. Thousands of scientists, including landscape ecologists, global change biologists, and habitat specialists have relied on these valuable satellite-based NDVI images for decades. Up-close infrared imagingThe goal of the Infragram project is to bring the power of NDVI and other infrared vegetation images back to earth where everyone can now take close-up images of plants or landscapes and instantly learn about their health and vigor. There are public sources of infrared photography for the US available through the Department of Agriculture -- NAIP and Vegscape -- but this imagery is not collected when, as often, or at useable scale for individuals who are managing small plots. By creating a low-cost camera and working with farmers and environmental activists, we hope to explore grassroots uses for this kind of technology. What could farmers or activists do with leaf-scale, plant-scale, lot-scale, and field-scale data on plant health if the equipment costs as little as $10 or $35?
Screenshot from 2011-09-10-colorado-boulder-foothills-community-park-NRG. See how clearly plants are identifiable from bare earth or pavement. The unique colors in this photo will be explained below, keep reading! Why does it work? (quick science)Though we cannot perceive it with our eyes, everything around us (including plants) reflects and absorbs wavelengths of light in red, green, blue and beyond into infrared, ultraviolet, and more. Our colorful world is created by varying amounts of particular wavelengths being absorbed and reflected. This also means that everything has a recognizable "spectral signature". Whoa. Let's focus on plants:
Plants use visible light (mainly blue and red light) as 'food' -- but not so much green light, which is why they reflect green away, and thus look green to our eyes. They also happen to reflect near infrared light (which is just beyond red light, but not visible to the human eye). This is because they chemically cannot convert infrared into usable food, and so they just bounce it away to stay cool. The illustrations show what colors of light plants absorb versus reflect away. By using this unique property of plants, plus our ability to take near-infrared photos we can create composite images which highlight where plants are and how much they are photosynthesizing.
Figure above: Normal color photo (top) and normalized difference vegetation index (NDVI) image. NDVI image was derived from two color channels in a single photo taken with a camera modified with a special infrared filter. Note that tree trunks, brown grass, and rocks have very low NDVI values because they are not photosynthetic. Healthy plants typically have NDVI values between 0.1 and 0.9.
How do we do it? (prototypes, links)The Public Lab community has been hacking cheap digital cameras for years. If you are interested in the story of how this project got started, check out our early prototypes and experiments on this page: http://publiclab.org/wiki/near-infrared-camera-history. There are many different versions, and we're offering our favorites as rewards for Kickstarter backers:
For all these rewards, this campaign is our opportunity to go in together and make a bulk order so that we all get the biggest bang for our buck.
|
Revert | |
| 109 | liz |
May 17, 2013 19:14
| almost 11 years ago
"The Infra-whatnow?"The Infragram is a simple, affordable infrared camera platform -- developed collaboratively, by the Public Lab community -- for measuring plant health and geeking out on gardening. It's for farmers, gardeners, DIY scientists, hikers, makers, farmers, teachers, kids, artists, and you!
It was originally developed to assess damage to wetlands in the wake of the BP oil spill; but it's also a simple, easy-to-modify, open-source hardware and software tool that anyone who's curious about plant physiology and health can use. What is it good for?
Vineyards, large farms, and NASA all use near-infrared photography for assessment, usually by mounting expensive sensors on airplanes and satellites. Infragram brings this technology to average citizens, enabling them to monitor their environment through quantifiable, citizen-generated data. Just as photography was instrumental to the rise of credible print journalism, DIY data collection technologies like Infragram democratize and improve reporting about environmental impacts. Remote infrared imagingThe study of Earth's environment from space got its start in 1972 when the first Landsat satellite was launched. The multispectral scanner it carried, like the scanners on all subsequent Landsat satellites, recorded images with both visible and near infrared light. Remote sensing scientists quickly learned that by combining visible and infrared data, they could reveal critical information about the health of vegetation. For example, the normalized difference vegetation index (NDVI) highlights the difference between the red and infrared wavelengths that are reflected from vegetation. Because red light is used by plants for photosynthesis but infrared light is not, NDVI allows scientists to estimate the amount of healthy foliage in every satellite image. Thousands of scientists, including landscape ecologists, global change biologists, and habitat specialists have relied on these valuable satellite-based NDVI images for decades. Up-close infrared imagingThe goal of the Infragram project is to bring the power of NDVI and other infrared vegetation images back to earth where everyone can now take close-up images of plants or landscapes and instantly learn about their health and vigor. There are public sources of infrared photography for the US available through the Department of Agriculture -- NAIP and Vegscape -- but this imagery is not collected when, as often, or at useable scale for individuals who are managing small plots. By creating a low-cost camera and working with farmers and environmental activists, we hope to explore grassroots uses for this kind of technology. What could farmers or activists do with leaf-scale, plant-scale, lot-scale, and field-scale data on plant health if the equipment costs as little as $10 or $35?
Screenshot from 2011-09-10-colorado-boulder-foothills-community-park-NRG. See how clearly plants are identifiable from bare earth or pavement. The unique colors in this photo will be explained below, keep reading! Why does it work? (quick science)Though we cannot perceive it with our eyes, everything around us (including plants) reflect wavelengths of light in red, green, blue and beyond into infrared, ultraviolet, and more. Our colorful world is created by varying amounts of particular wavelengths being absorbed and reflected. This also means that everything has a recognizable "spectral signature". Whoa. Let's focus on plants:
Plants use visible light (mainly blue and red light) as 'food' -- but not so much green light, which is why they reflect green away, and thus look green to our eyes. They also happen to reflect near infrared light (which is just beyond red light, but not visible to the human eye). This is because they chemically cannot convert infrared into usable food, and so they just bounce it away to stay cool. The illustrations show what colors of light plants absorb versus reflect away. By using this unique property of plants, plus our ability to take near-infrared photos we can create composite images which highlight where plants are and how much they are photosynthesizing.
Figure above: Normal color photo (top) and normalized difference vegetation index (NDVI) image. NDVI image was derived from two color channels in a single photo taken with a camera modified with a special infrared filter. Note that tree trunks, brown grass, and rocks have very low NDVI values because they are not photosynthetic. Healthy plants typically have NDVI values between 0.1 and 0.9.
How do we do it? (prototypes, links)The Public Lab community has been hacking cheap digital cameras for years. If you are interested in the story of how this project got started, check out our early prototypes and experiments on this page: http://publiclab.org/wiki/near-infrared-camera-history. There are many different versions, and we're offering our favorites as rewards for Kickstarter backers:
For all these rewards, this campaign is our opportunity to go in together and make a bulk order so that we all get the biggest bang for our buck.
|
Revert | |
| 108 | liz |
May 17, 2013 19:01
| almost 11 years ago
"The Infra-whatnow?"The Infragram is a simple, affordable infrared camera platform -- developed collaboratively, by the Public Lab community -- for measuring plant health and geeking out on gardening. It's for farmers, gardeners, DIY scientists, hikers, makers, farmers, teachers, kids, artists, and you!
It was originally developed to assess damage to wetlands in the wake of the BP oil spill; but it's also a simple, easy-to-modify, open-source hardware and software tool that anyone who's curious about plant physiology and health can use. What is it good for?
Vineyards, large farms, and NASA all use near-infrared photography for assessment, usually by mounting expensive sensors on airplanes and satellites. Infragram brings this technology to average citizens, enabling them to monitor their environment through quantifiable, citizen-generated data. Just as photography was instrumental to the rise of credible print journalism, DIY data collection technologies like Infragram democratize and improve reporting about environmental impacts. Remote infrared imagingThe study of Earth's environment from space got its start in 1972 when the first Landsat satellite was launched. The multispectral scanner it carried, like the scanners on all subsequent Landsat satellites, recorded images with both visible and near infrared light. Remote sensing scientists quickly learned that by combining visible and infrared data, they could reveal critical information about the health of vegetation. For example, the normalized difference vegetation index (NDVI) highlights the difference between the red and infrared wavelengths that are reflected from vegetation. Because red light is used by plants for photosynthesis but infrared light is not, NDVI allows scientists to estimate the amount of healthy foliage in every satellite image. Thousands of scientists, including landscape ecologists, global change biologists, and habitat specialists have relied on these valuable satellite-based NDVI images for decades. Up-close infrared imagingThe goal of the Infragram project is to bring the power of NDVI and other infrared vegetation images back to earth where everyone can now take close-up images of plants or landscapes and instantly learn about their health and vigor. There are public sources of infrared photography for the US available through the Department of Agriculture -- NAIP and Vegscape -- but this imagery is not collected when, as often, or at useable scale for individuals who are managing small plots. By creating a low-cost camera and working with farmers and environmental activists, we hope to explore grassroots uses for this kind of technology. What could farmers or activists do with leaf-scale, plant-scale, lot-scale, and field-scale data on plant health if the equipment costs as little as $10 or $35?
Screenshot from 2011-09-10-colorado-boulder-foothills-community-park-NRG. See how clearly plants are identifiable from bare earth or pavement. The unique colors in this photo will be explained below, keep reading! Why does it work? (quick science)Though we cannot perceive it with our eyes, everything around us (including plants) reflect wavelengths of light in red, green, blue and beyond into infrared, ultraviolet, and more. Our colorful world is created by varying amounts of particular wavelengths being absorbed and reflected. This also means that everything has a recognizable "spectral signature". Whoa. Let's focus on plants:
Plants use visible light (mainly blue and red light) as 'food' -- but not so much green light, which is why they reflect green away, and thus look green to our eyes. They also happen to reflect near infrared light (which is just beyond red light, but not visible to the human eye). This is because they chemically cannot convert infrared into usable food, and so they just bounce it away to stay cool. The illustrations show what colors of light plants absorb versus reflect away. By using this unique property of plants, plus our ability to take near-infrared photos we can create composite images which highlight where plants are and how much they are photosynthesizing.
Figure above: Normal color photo (top) and normalized difference vegetation index (NDVI) image. NDVI image was derived from two color channels in a single photo taken with a camera modified with a special infrared filter. Note that tree trunks, brown grass, and rocks have very low NDVI values because they are not photosynthetic. Healthy plants typically have NDVI values between 0.1 and 0.9.
How do we do it? (prototypes, links)The Public Lab community has been hacking cheap digital cameras for years. If you are interested in the story of how this project got started, check out our early prototypes and experiments on this page: http://publiclab.org/wiki/near-infrared-camera-history.
|
Revert | |
| 107 | liz |
May 17, 2013 18:08
| almost 11 years ago
"The Infra-whatnow?"The Infragram is a simple, affordable infrared camera platform -- developed collaboratively, by the Public Lab community -- for measuring plant health and geeking out on gardening. It's for farmers, gardeners, DIY scientists, hikers, makers, farmers, teachers, kids, artists, and you!
It was originally developed to assess damage to wetlands in the wake of the BP oil spill; but it's also a simple, easy-to-modify, open-source hardware and software tool that anyone who's curious about plant physiology and health can use. What is it good for?
Vineyards, large farms, and NASA all use near-infrared photography for assessment, usually by mounting expensive sensors on airplanes and satellites. Infragram brings this technology to average citizens, enabling them to monitor their environment through quantifiable, citizen-generated data. Just as photography was instrumental to the rise of credible print journalism, DIY data collection technologies like Infragram democratize and improve reporting about environmental impacts. Remote infrared imagingThe study of Earth's environment from space got its start in 1972 when the first Landsat satellite was launched. The multispectral scanner it carried, like the scanners on all subsequent Landsat satellites, recorded images with both visible and near infrared light. Remote sensing scientists quickly learned that by combining visible and infrared data, they could reveal critical information about the health of vegetation. For example, the normalized difference vegetation index (NDVI) highlights the difference between the red and infrared wavelengths that are reflected from vegetation. Because red light is used by plants for photosynthesis but infrared light is not, NDVI allows scientists to estimate the amount of healthy foliage in every satellite image. Thousands of scientists, including landscape ecologists, global change biologists, and habitat specialists have relied on these valuable satellite-based NDVI images for decades. Up-close infrared imagingThe goal of the Infragram project is to bring the power of NDVI and other infrared vegetation images back to earth where everyone can now take close-up images of plants or landscapes and instantly learn about their health and vigor. There are public sources of infrared photography for the US available through the Department of Agriculture -- NAIP and Vegscape -- but this imagery is not collected when, as often, or at useable scale for individuals who are managing small plots. By creating a low-cost camera and working with farmers and environmental activists, we hope to explore grassroots uses for this kind of technology. What could farmers or activists do with leaf-scale, plant-scale, lot-scale, and field-scale data on plant health if the equipment costs as little as $10 or $35?
Screenshot from 2011-09-10-colorado-boulder-foothills-community-park-NRG. See how clearly plants are identifiable from bare earth or pavement. The unique colors in this photo will be explained below, keep reading! Why does it work? (quick science)Though we cannot perceive it with our eyes, everything around us (including plants) reflect wavelengths of light in red, green, blue and beyond into infrared, ultraviolet, and more. Our colorful world is created by varying amounts of particular wavelengths being absorbed and reflected. This also means that everything has a recognizable "spectral signature". Whoa. Let's focus on plants:
Plants use visible light (mainly blue and red light) as 'food' -- but not so much green light, which is why they reflect green away, and thus look green to our eyes. They also happen to reflect near infrared light (which is just beyond red light, but not visible to the human eye). This is because they chemically cannot convert infrared into usable food, and so they just bounce it away to stay cool. The illustrations show what colors of light plants absorb versus reflect away. By using this unique property of plants, plus our ability to take near-infrared photos we can create composite images which highlight where plants are and how much they are photosynthesizing.
Figure above: Normal color photo (top) and normalized difference vegetation index (NDVI) image. NDVI image was derived from two color channels in a single photo taken with a camera modified with a special infrared filter. Note that tree trunks, brown grass, and rocks have very low NDVI values because they are not photosynthetic. Healthy plants typically have NDVI values between 0.1 and 0.9.
How do we do it? (prototypes, links)The Public Lab community has been hacking cheap digital cameras for years. If you are interested in the story of how this project got started, check out our early prototypes and experiments on this page: http://publiclab.org/wiki/near-infrared-camera.
|
Revert | |
| 106 | liz |
May 17, 2013 18:05
| almost 11 years ago
"The Infra-whatnow?"The Infragram is a simple, affordable infrared camera platform -- developed collaboratively, by the Public Lab community -- for measuring plant health and geeking out on gardening. It's for farmers, gardeners, DIY scientists, hikers, makers, farmers, teachers, kids, artists, and you!
It was originally developed to assess damage to wetlands in the wake of the BP oil spill; but it's also a simple, easy-to-modify, open-source hardware and software tool that anyone who's curious about plant physiology and health can use. What is it good for?
Vineyards, large farms, and NASA all use near-infrared photography for assessment, usually by mounting expensive sensors on airplanes and satellites. Infragram brings this technology to average citizens, enabling them to monitor their environment through quantifiable, citizen-generated data. Just as photography was instrumental to the rise of credible print journalism, DIY data collection technologies like Infragram democratize and improve reporting about environmental impacts. Remote infrared imagingThe study of Earth's environment from space got its start in 1972 when the first Landsat satellite was launched. The multispectral scanner it carried, like the scanners on all subsequent Landsat satellites, recorded images with both visible and near infrared light. Remote sensing scientists quickly learned that by combining visible and infrared data, they could reveal critical information about the health of vegetation. For example, the normalized difference vegetation index (NDVI) highlights the difference between the red and infrared wavelengths that are reflected from vegetation. Because red light is used by plants for photosynthesis but infrared light is not, NDVI allows scientists to estimate the amount of healthy foliage in every satellite image. Thousands of scientists, including landscape ecologists, global change biologists, and habitat specialists have relied on these valuable satellite-based NDVI images for decades. Up-close infrared imagingThe goal of the Infragram project is to bring the power of NDVI and other infrared vegetation images back to earth where everyone can now take close-up images of plants or landscapes and instantly learn about their health and vigor. There are public sources of infrared photography for the US available through the Department of Agriculture -- NAIP and Vegscape -- but this imagery is not collected when, as often, or at useable scale for individuals who are managing small plots. By creating a low-cost camera and working with farmers and environmental activists, we hope to explore grassroots uses for this kind of technology. What could farmers or activists do with leaf-scale, plant-scale, lot-scale, and field-scale data on plant health if the equipment costs as little as $10 or $35?
Screenshot from 2011-09-10-colorado-boulder-foothills-community-park-NRG. See how clearly plants are identifiable from bare earth or pavement. The unique colors in this photo will be explained below, keep reading! Why does it work? (quick science)Though we cannot perceive it with our eyes, everything around us (including plants) reflect wavelengths of light in red, green, blue and beyond into infrared, ultraviolet, and more. Our colorful world is created by varying amounts of particular wavelengths being absorbed and reflected. This also means that everything has a recognizable "spectral signature". Whoa. Let's focus on plants:
Plants use visible light (mainly blue and red light) as 'food' -- but not so much green light, which is why they reflect green away, and thus look green to our eyes. They also happen to reflect near infrared light (which is just beyond red light, but not visible to the human eye). This is because they chemically cannot convert infrared into usable food, and so they just bounce it away to stay cool. The illustrations show what colors of light plants absorb versus reflect away. By using this unique property of plants, plus our ability to take near-infrared photos we can create composite images which highlight where plants are and how much they are photosynthesizing.
Figure above: Normal color photo (top) and normalized difference vegetation index (NDVI) image. NDVI image was derived from two color channels in a single photo taken with a camera modified with a special infrared filter. Note that tree trunks, brown grass, and rocks have very low NDVI values because they are not photosynthetic. Healthy plants typically have NDVI values between 0.1 and 0.9.
How do we do it? (prototypes, links)
|
Revert | |
| 105 | liz |
May 17, 2013 18:04
| almost 11 years ago
"The Infra-whatnow?"The Infragram is a simple, affordable infrared camera platform -- developed collaboratively, by the Public Lab community -- for measuring plant health and geeking out on gardening. It's for farmers, gardeners, DIY scientists, hikers, makers, farmers, teachers, kids, artists, and you!
It was originally developed to assess damage to wetlands in the wake of the BP oil spill; but it's also a simple, easy-to-modify, open-source hardware and software tool that anyone who's curious about plant physiology and health can use. What is it good for?
Vineyards, large farms, and NASA all use near-infrared photography for assessment, usually by mounting expensive sensors on airplanes and satellites. Infragram brings this technology to average citizens, enabling them to monitor their environment through quantifiable, citizen-generated data. Just as photography was instrumental to the rise of credible print journalism, DIY data collection technologies like Infragram democratize and improve reporting about environmental impacts. Remote infrared imagingThe study of Earth's environment from space got its start in 1972 when the first Landsat satellite was launched. The multispectral scanner it carried, like the scanners on all subsequent Landsat satellites, recorded images with both visible and near infrared light. Remote sensing scientists quickly learned that by combining visible and infrared data, they could reveal critical information about the health of vegetation. For example, the normalized difference vegetation index (NDVI) highlights the difference between the red and infrared wavelengths that are reflected from vegetation. Because red light is used by plants for photosynthesis but infrared light is not, NDVI allows scientists to estimate the amount of healthy foliage in every satellite image. Thousands of scientists, including landscape ecologists, global change biologists, and habitat specialists have relied on these valuable satellite-based NDVI images for decades. Up-close infrared imagingThe goal of the Infragram project is to bring the power of NDVI and other infrared vegetation images back to earth where everyone can now take close-up images of plants or landscapes and instantly learn about their health and vigor. There are public sources of infrared photography for the US available through the Department of Agriculture -- NAIP and Vegscape -- but this imagery is not collected when, as often, or at useable scale for individuals who are managing small plots. By creating a low-cost camera and working with farmers and environmental activists, we hope to explore grassroots uses for this kind of technology. What could farmers or activists do with leaf-scale, plant-scale, lot-scale, and field-scale data on plant health if the equipment costs as little as $10 or $35?
Screenshot from 2011-09-10-colorado-boulder-foothills-community-park-NRG. See how clearly plants are identifiable from bare earth or pavement. The unique colors in this photo will be explained below, keep reading! Why does it work? (quick science)Though we cannot perceive it with our eyes, everything around us (including plants) reflect wavelengths of light in red, green, blue and beyond into infrared, ultraviolet, and more. Our colorful world is created by varying amounts of particular wavelengths being absorbed and reflected. This also means that everything has a recognizable "spectral signature". Whoa. Let's focus on plants:
Plants use visible light (mainly blue and red light) as 'food' -- but not so much green light, which is why they reflect green away, and thus look green to our eyes. They also happen to reflect near infrared light (which is just beyond red light, but not visible to the human eye). This is because they chemically cannot convert infrared into usable food, and so they just bounce it away to stay cool. The illustrations show what colors of light plants absorb versus reflect away. By using this unique property of plants, plus our ability to take near-infrared photos we can create composite images which highlight where plants are and how much they are photosynthesizing.
Figure above: Normal color photo (top) and normalized difference vegetation index (NDVI) image. NDVI image was derived from two color channels in a single photo taken with a camera modified with a special infrared filter. Note that tree trunks, brown grass, and rocks have very low NDVI values because they are not photosynthetic. Healthy plants typically have NDVI values between 0.1 and 0.9.
How do we do it? (prototypes, links)
|
Revert | |
| 104 | liz |
May 17, 2013 17:58
| almost 11 years ago
"The Infra-whatnow?"The Infragram is a simple, affordable infrared camera platform -- developed collaboratively, by the Public Lab community -- for measuring plant health and geeking out on gardening. It's for farmers, gardeners, DIY scientists, hikers, makers, farmers, teachers, kids, artists, and you!
It was originally developed to assess damage to wetlands in the wake of the BP oil spill; but it's also a simple, easy-to-modify, open-source hardware and software tool that anyone who's curious about plant physiology and health can use. What is it good for?
Vineyards, large farms, and NASA all use near-infrared photography for assessment, usually by mounting expensive sensors on airplanes and satellites. Infragram brings this technology to average citizens, enabling them to monitor their environment through quantifiable, citizen-generated data. Just as photography was instrumental to the rise of credible print journalism, DIY data collection technologies like Infragram democratize and improve reporting about environmental impacts. Remote infrared imagingThe study of Earth's environment from space got its start in 1972 when the first Landsat satellite was launched. The multispectral scanner it carried, like the scanners on all subsequent Landsat satellites, recorded images with both visible and near infrared light. Remote sensing scientists quickly learned that by combining visible and infrared data, they could reveal critical information about the health of vegetation. For example, the normalized difference vegetation index (NDVI) highlights the difference between the red and infrared wavelengths that are reflected from vegetation. Because red light is used by plants for photosynthesis but infrared light is not, NDVI allows scientists to estimate the amount of healthy foliage in every satellite image. Thousands of scientists, including landscape ecologists, global change biologists, and habitat specialists have relied on these valuable satellite-based NDVI images for decades. Up-close infrared imagingThe goal of the Infragram project is to bring the power of NDVI and other infrared vegetation images back to earth where everyone can now take close-up images of plants or landscapes and instantly learn about their health and vigor. There are public sources of infrared photography for the US available through the Department of Agriculture -- NAIP and Vegscape -- but this imagery is not collected when, as often, or at useable scale for individuals who are managing small plots. By creating a low-cost camera and working with farmers and environmental activists, we hope to explore grassroots uses for this kind of technology. What could farmers or activists do with leaf-scale, plant-scale, lot-scale, and field-scale data on plant health if the equipment costs as little as $10 or $35?
Screenshot from 2011-09-10-colorado-boulder-foothills-community-park-NRG. See how clearly plants are identifiable from bare earth or pavement. The unique colors in this photo will be explained below, keep reading! Why does it work? (quick science)Though we cannot perceive it with our eyes, everything around us (including plants) reflect wavelengths of light in red, green, blue and beyond into infrared, ultraviolet, and more. Our colorful world is created by varying amounts of particular wavelengths being absorbed and reflected. This also means that everything has a recognizable "spectral signature". Whoa.
Plants use visible light (mainly blue and red light) as 'food' -- but not so much green light, which is why they reflect green away, and thus look green to our eyes. They also happen to reflect near infrared light (which is just beyond red light, but not visible to the human eye). This is because they chemically cannot convert infrared into usable food, and so they just bounce it away to stay cool. The illustrations show what colors of light plants absorb versus reflect away.
By using this unique property of plants, plus our ability to take near-infrared photos we can create composite images which highlight where plants are and how much they are photosynthesizing.
Figure above: Normal color photo (top) and normalized difference vegetation index (NDVI) image. NDVI image was derived from two color channels in a single photo taken with a camera modified with a special infrared filter. Note that tree trunks, brown grass, and rocks have very low NDVI values because they are not photosynthetic. Healthy plants typically have NDVI values between 0.1 and 0.9.
How do we do it? (prototypes, links)
|
Revert | |
| 103 | liz |
May 17, 2013 17:52
| almost 11 years ago
"The Infra-whatnow?"The Infragram is a simple, affordable infrared camera platform -- developed collaboratively, by the Public Lab community -- for measuring plant health and geeking out on gardening. It's for farmers, gardeners, and DIY scientists!
It was originally developed to assess damage to wetlands in the wake of the BP oil spill; but it's also a simple, easy-to-modify, open-source hardware and software tool that home gardeners, hikers, makers, farmers, amateur scientists, teachers, artists, and anyone who's curious about plant physiology and health can use. What is it good for?
Vineyards, large farms, and NASA all use near-infrared photography for assessment, usually by mounting expensive sensors on airplanes and satellites. Infragram brings this technology to average citizens, enabling them to monitor their environment through quantifiable, citizen-generated data. Just as photography was instrumental to the rise of credible print journalism, DIY data collection technologies like Infragram democratize and improve reporting about environmental impacts. Remote infrared imagingThe study of Earth's environment from space got its start in 1972 when the first Landsat satellite was launched. The multispectral scanner it carried, like the scanners on all subsequent Landsat satellites, recorded images with both visible and near infrared light. Remote sensing scientists quickly learned that by combining visible and infrared data, they could reveal critical information about the health of vegetation. For example, the normalized difference vegetation index (NDVI) highlights the difference between the red and infrared wavelengths that are reflected from vegetation. Because red light is used by plants for photosynthesis but infrared light is not, NDVI allows scientists to estimate the amount of healthy foliage in every satellite image. Thousands of scientists, including landscape ecologists, global change biologists, and habitat specialists have relied on these valuable satellite-based NDVI images for decades. Up-close infrared imagingThe goal of the Infragram project is to bring the power of NDVI and other infrared vegetation images back to earth where everyone can now take close-up images of plants or landscapes and instantly learn about their health and vigor. Infrared imagery for agricultural and ecological assessment is usually captured from planes, and the information is used mainly by industrial farms, vineyards, and and government environmental managers. For example, see this illustrated PDF from a commercial imagery provider who has been studying the usefulness of infrared imagery and has quotes from farmers who use it. There are public sources of infrared photography for the US available through the Department of Agriculture -- NAIP and Vegscape -- but this imagery is not collected when, as often, or at useable scale for individuals who are managing small plots. By creating a low-cost camera and working with farmers and environmental activists, we hope to explore grassroots uses for this kind of technology. What could farmers or activists do with leaf-scale, plant-scale, lot-scale, and field-scale data on plant health if the equipment costs as little as $10 or $35?
Screenshot from 2011-09-10-colorado-boulder-foothills-community-park-NRG. See how clearly plants are identifiable from bare earth or pavement. The unique colors in this photo will be explained below, keep reading! Why does it work? (quick science)Though we cannot perceive it with our eyes, everything around us (including plants) reflect wavelengths of light in red, green, blue and beyond into infrared, ultraviolet, and more. Our colorful world is created by varying amounts of particular wavelengths being absorbed and reflected. This also means that everything has a recognizable "spectral signature". Whoa.
Plants use visible light (mainly blue and red light) as 'food' -- but not so much green light, which is why they reflect green away, and thus look green to our eyes. They also happen to reflect near infrared light (which is just beyond red light, but not visible to the human eye). This is because they chemically cannot convert infrared into usable food, and so they just bounce it away to stay cool. The illustrations show what colors of light plants absorb versus reflect away.
By using this unique property of plants, plus our ability to take near-infrared photos we can create composite images which highlight where plants are and how much they are photosynthesizing.
Figure above: Normal color photo (top) and normalized difference vegetation index (NDVI) image. NDVI image was derived from two color channels in a single photo taken with a camera modified with a special infrared filter. Note that tree trunks, brown grass, and rocks have very low NDVI values because they are not photosynthetic. Healthy plants typically have NDVI values between 0.1 and 0.9.
How do we do it? (prototypes, links)
|
Revert |