 Jeff W/Chris F are working on this feature for the upcoming Grassroots Mapping Forum. Sourcing a lot from: http://publiclaboratory.org/wiki/dual-camera-kit-guide, images from: http://publiclaboratory.org/notes/warren/5-17-2012/infrared-camera-how-guide-gm-forum
##Current draft##
_Based on input from Mathew, a shorter piece more based on introduction:_
Jeff W/Chris F are working on this feature for the upcoming Grassroots Mapping Forum. Sourcing a lot from: http://publiclaboratory.org/wiki/dual-camera-kit-guide, images from: http://publiclaboratory.org/notes/warren/5-17-2012/infrared-camera-how-guide-gm-forum
##Current draft##
_Based on input from Mathew, a shorter piece more based on introduction:_
 ##Wetlands and farm mapping##
Over the past two years, two distinct problems have led to the development of an inexpensive infrared camera at Public Lab. First, the desire to better understand the damage to wetland vegetation caused by the Deepwater Horizon oil spill led some of us to try to duplicate some of the sensors (infrared cameras) which are found onboard many satellites, and which are commonly used to assess vegetation health. Second, the desire of farmers to quantify plant health or stress, either to prove new, more effective organic farming practices or to reduce the use of fertilizer and thus agricultural runoff.
Both scenarios also made use of our existing ability to reliably take aerial images using balloon- and kite-borne cameras. Here we'll be discussing how this works, why, and giving you a starting point to begin taking infrared photos yourself.
##Plant health & color##
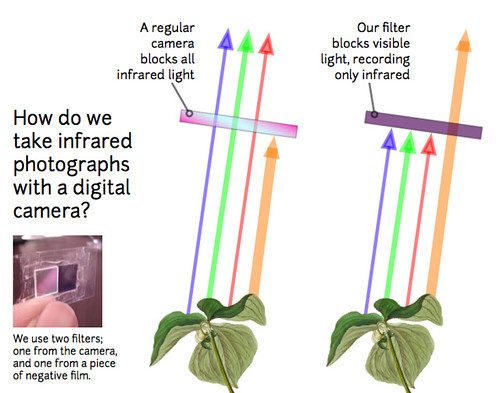
One way to measure plant health is to compare the amount of red light reflected by foliage to the amount of infrared light reflected. Plants are green because leaves reflect green light -- they don’t use it for photosynthesis, and they also reflect almost all infrared light, which we can't see (Figure 1). Instead they use the blue and red wavelengths which are absorbed by the pigments in the leaves. The bigger the difference between the "redness" and the "infrared-ness" of the light reflected from a plant, the more the plant is photosynthesizing, and the healthier it is. The PLOTS IR camera tool allows us to compare how much red light and infrared light are reflected from plants and produce an index of how healthy or stressed the plants are (the Normalized Difference Vegetation Index or NDVI).
##Wetlands and farm mapping##
Over the past two years, two distinct problems have led to the development of an inexpensive infrared camera at Public Lab. First, the desire to better understand the damage to wetland vegetation caused by the Deepwater Horizon oil spill led some of us to try to duplicate some of the sensors (infrared cameras) which are found onboard many satellites, and which are commonly used to assess vegetation health. Second, the desire of farmers to quantify plant health or stress, either to prove new, more effective organic farming practices or to reduce the use of fertilizer and thus agricultural runoff.
Both scenarios also made use of our existing ability to reliably take aerial images using balloon- and kite-borne cameras. Here we'll be discussing how this works, why, and giving you a starting point to begin taking infrared photos yourself.
##Plant health & color##
One way to measure plant health is to compare the amount of red light reflected by foliage to the amount of infrared light reflected. Plants are green because leaves reflect green light -- they don’t use it for photosynthesis, and they also reflect almost all infrared light, which we can't see (Figure 1). Instead they use the blue and red wavelengths which are absorbed by the pigments in the leaves. The bigger the difference between the "redness" and the "infrared-ness" of the light reflected from a plant, the more the plant is photosynthesizing, and the healthier it is. The PLOTS IR camera tool allows us to compare how much red light and infrared light are reflected from plants and produce an index of how healthy or stressed the plants are (the Normalized Difference Vegetation Index or NDVI).
 ##Hacked DIY Infrared cameras##
To evaluate plant productivity, you compare an infrared photo with a regular "visible light" photo of exactly the same view. We've begun hacking cheap digital cameras by removing their "infrared block" filters, which are deep inside, right against the sensor. Canon cameras (the A490/A495 especially) are easy to modify in about 10-15 minutes, and we've published a YouTube video on the process (see links below).
We replace the IR-block filter with a piece of exposed color film negative -- just buy a fresh roll of color film, expose the whole roll by pulling it out of its canister, roll it up and have it made into negatives -- the whole thing should cost you ~$8. Then carefully cut out a clean piece (no fingerprints!) identical in size to the filter you removed and place it where you removed the IR-block filter. This will block all visible light, but is transparent to infrared light. Reassemble the camera and you can take infrared photos!
(Try photographing the rest of your film negatives -- they'll be transparent to the camera!)
##Combining images from two cameras##
The process involves taking photos with the infrared camera and matching photos with a second, unmodified camera. Then the visible and infrared photos must be exactly aligned -- "compositing" them using Photoshop, GIMP, or automated scripts currently in development (see links below).
##Hacked DIY Infrared cameras##
To evaluate plant productivity, you compare an infrared photo with a regular "visible light" photo of exactly the same view. We've begun hacking cheap digital cameras by removing their "infrared block" filters, which are deep inside, right against the sensor. Canon cameras (the A490/A495 especially) are easy to modify in about 10-15 minutes, and we've published a YouTube video on the process (see links below).
We replace the IR-block filter with a piece of exposed color film negative -- just buy a fresh roll of color film, expose the whole roll by pulling it out of its canister, roll it up and have it made into negatives -- the whole thing should cost you ~$8. Then carefully cut out a clean piece (no fingerprints!) identical in size to the filter you removed and place it where you removed the IR-block filter. This will block all visible light, but is transparent to infrared light. Reassemble the camera and you can take infrared photos!
(Try photographing the rest of your film negatives -- they'll be transparent to the camera!)
##Combining images from two cameras##
The process involves taking photos with the infrared camera and matching photos with a second, unmodified camera. Then the visible and infrared photos must be exactly aligned -- "compositing" them using Photoshop, GIMP, or automated scripts currently in development (see links below).

 ##Interpretation##
Many factors can make a plant healthier than one growing near it: more water, more soil nutrients, fewer pests, less competition, or just the inherent ability of some species to photosynthesize more than others. Interpreting the patterns in an NDVI image can be easy when some plants are known to be stressed, but in other cases can require some understanding of the complex interactions among neighboring plants and their environment. Although there is 40 years of literature on interpreting low resolution (30 to 250 m per pixel) satellite NDVI images, the high resolution (3 to 15 cm per pixel) images possible with our IR camera tool could provide novel insights into fine-scale vegetation patterns.
We are still learning how to extract meaningful information from these NDVI images and look forward to getting feedback about how to do this. We are currently working on interpreting the results of a balloon mapping flight over some cover crop trials in New Hampshire. In the example images below the rectangular plots received different nutrient or management treatments, and both the normal black and white photo and the NDVI image reveal that plants responded differently to some treatments.
##Interpretation##
Many factors can make a plant healthier than one growing near it: more water, more soil nutrients, fewer pests, less competition, or just the inherent ability of some species to photosynthesize more than others. Interpreting the patterns in an NDVI image can be easy when some plants are known to be stressed, but in other cases can require some understanding of the complex interactions among neighboring plants and their environment. Although there is 40 years of literature on interpreting low resolution (30 to 250 m per pixel) satellite NDVI images, the high resolution (3 to 15 cm per pixel) images possible with our IR camera tool could provide novel insights into fine-scale vegetation patterns.
We are still learning how to extract meaningful information from these NDVI images and look forward to getting feedback about how to do this. We are currently working on interpreting the results of a balloon mapping flight over some cover crop trials in New Hampshire. In the example images below the rectangular plots received different nutrient or management treatments, and both the normal black and white photo and the NDVI image reveal that plants responded differently to some treatments.
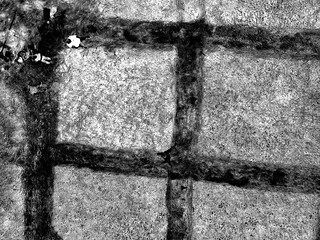
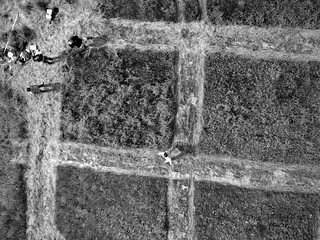 In this normal black and white photograph, the mowed paths are lighter than the plots because the cut plants are dead and pale. In the upper left plot the lighter plants are hairy vetch, a nitrogen-fixing legume, and there is more vetch in that plot than in the other three.
 In this NDVI image, the lighter areas have the highest NDVI values representing the most productive plants. The mowed paths are dark because the dead clippings are not photosynthesizing. The upper left plot is generally lighter than the other three plots. Although the upper left plot has more vetch, the vetch itself does not have the highest (brightest) NDVI values. One hypothesis to explain this is that the additional nitrogen fixed by the vetch is increasing the growth of neighboring plants.
##Contributors welcome!##
Our work is far from complete -- many steps are difficult or time consuming, and we need your help to:
* streamline and simplify the process of taking infrared photos
* experiment with infrared mapping techniques by making more infrared maps
* help people interpret infrared images
To learn more and get involved, see:
http://publiclaboratory.org/tool/near-infrared-camera (a page which needs revision)
http://publiclaboratory.org/wiki/dual-camera-kit-guide (a newer page which could be merged with the above)
-------
##Older, longer outline##
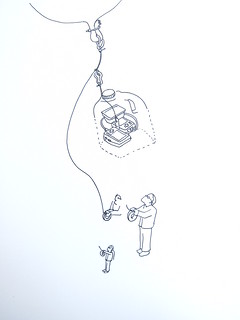
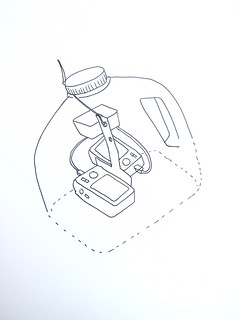
Six small features organized around a central large graphic (see above sketch) on an approx 11x17 area.
###1. Science background###
* base on Chris' page: http://publiclaboratory.org/wiki/ndvi-plots-ir-camera-kit
* Is this your illustration: https://www.flickr.com/photos/jeffreywarren/5416397210/? We could modify that for B&W
* NIR by itself looks cool but does not highlight meaningful patterns well.
* NRG is false color IR with vegetation in shades of red and pink
* NDVI highlights areas of high or low photosynthetic activity
###2. A second camera to capture NIR###
* How to modify a camera (YouTube vid, illustrations)
* How to mount two cameras
* image heavy section...
###3. Triggering the cameras in flight###
* **Simple version:** rubber bands or independent intervalometers/CHDK
* **Advanced:** Simultaneous triggering makes post-processing much easier
* CHDK to enable synchronous remote via USB on Canon Powershots
* USB cable mod, MK111 timer
###4. Matching and compositing images###
* Synchronize the cameras’ clocks
* Capture jpgs
* Identify NIR/VIS photo pairs via timestamps
* Use Ned’s Fiji macro (requires well-overlapped, sharp photos, and good organizational skills)
* Make structure from motion models in Hypr3D
* Stitch images in MS ICE or GIMP
* Align images over a georeferenced map with MapKnitter
**Advanced:** To produce more precise results (link to web page):
* Synchronize the cameras’ clocks
* Capture RAW, convert to Tiff (need CHDK, big partitioned cards, RAWTherapee (e.g.), big hard drive)
* Identify NIR/VIS photo pairs via timestamps
* Use Ned’s Fiji macro
* Interpret pixel-level results (or almost)
* Make structure from motion models in Hypr3D or 123D Catch
* Stitch images in MS ICE, GIMP, or Agisoft PhotoScan (allows GPS control)
* Align images over a georeferenced map with Mapknitter
###5. Interpretation###
* One-time maps can reveal side by side differences in plant growth or health (Lee, NH)
* Time series of NDVI can reveal seasonal or year to year trends in plant growth and health (TBD)
* examples?
###6. Conclusion###
* online resources
* how to get involved
In this NDVI image, the lighter areas have the highest NDVI values representing the most productive plants. The mowed paths are dark because the dead clippings are not photosynthesizing. The upper left plot is generally lighter than the other three plots. Although the upper left plot has more vetch, the vetch itself does not have the highest (brightest) NDVI values. One hypothesis to explain this is that the additional nitrogen fixed by the vetch is increasing the growth of neighboring plants.
##Contributors welcome!##
Our work is far from complete -- many steps are difficult or time consuming, and we need your help to:
* streamline and simplify the process of taking infrared photos
* experiment with infrared mapping techniques by making more infrared maps
* help people interpret infrared images
To learn more and get involved, see:
http://publiclaboratory.org/tool/near-infrared-camera (a page which needs revision)
http://publiclaboratory.org/wiki/dual-camera-kit-guide (a newer page which could be merged with the above)
-------
##Older, longer outline##
Six small features organized around a central large graphic (see above sketch) on an approx 11x17 area.
###1. Science background###
* base on Chris' page: http://publiclaboratory.org/wiki/ndvi-plots-ir-camera-kit
* Is this your illustration: https://www.flickr.com/photos/jeffreywarren/5416397210/? We could modify that for B&W
* NIR by itself looks cool but does not highlight meaningful patterns well.
* NRG is false color IR with vegetation in shades of red and pink
* NDVI highlights areas of high or low photosynthetic activity
###2. A second camera to capture NIR###
* How to modify a camera (YouTube vid, illustrations)
* How to mount two cameras
* image heavy section...
###3. Triggering the cameras in flight###
* **Simple version:** rubber bands or independent intervalometers/CHDK
* **Advanced:** Simultaneous triggering makes post-processing much easier
* CHDK to enable synchronous remote via USB on Canon Powershots
* USB cable mod, MK111 timer
###4. Matching and compositing images###
* Synchronize the cameras’ clocks
* Capture jpgs
* Identify NIR/VIS photo pairs via timestamps
* Use Ned’s Fiji macro (requires well-overlapped, sharp photos, and good organizational skills)
* Make structure from motion models in Hypr3D
* Stitch images in MS ICE or GIMP
* Align images over a georeferenced map with MapKnitter
**Advanced:** To produce more precise results (link to web page):
* Synchronize the cameras’ clocks
* Capture RAW, convert to Tiff (need CHDK, big partitioned cards, RAWTherapee (e.g.), big hard drive)
* Identify NIR/VIS photo pairs via timestamps
* Use Ned’s Fiji macro
* Interpret pixel-level results (or almost)
* Make structure from motion models in Hypr3D or 123D Catch
* Stitch images in MS ICE, GIMP, or Agisoft PhotoScan (allows GPS control)
* Align images over a georeferenced map with Mapknitter
###5. Interpretation###
* One-time maps can reveal side by side differences in plant growth or health (Lee, NH)
* Time series of NDVI can reveal seasonal or year to year trends in plant growth and health (TBD)
* examples?
###6. Conclusion###
* online resources
* how to get involved