_This draft wiki page is a work in progress!_
Wastewater is “used water” that’s created by households, cities, and industry. It ranges from sewage to surface runoff that can flow from roadways into storm drains. Untreated or under-treated wastewater can contain a variety of pollutants that can harm people and ecosystems when it’s released into the environment.
On this page, we’re collecting information on some of the clues that might indicate wastewater pollution in the environment, and ways to investigate them. Some methods assess general water quality conditions that can correlate with wastewater pollution, while other methods can more directly signal the presence of wastewater by identifying specific pollutants.
### Detecting possible wastewater pollution
There’s lots of information (in English and Spanish) about what to look for in the comments of this question: [What are some observable tell-tale signs of wastewater pollution?](https://publiclab.org/questions/bhamster/07-28-2021/what-are-some-observable-tell-tale-signs-of-wastewater-pollution)
#### Change in water color or clarity
_**Why?**_ Solid particles, chemicals, or microscopic organisms in wastewater can give it a color or cloudy appearance. When wastewater is discharged into the environment, you might see a discolored plume in a river or a colored residue on land.
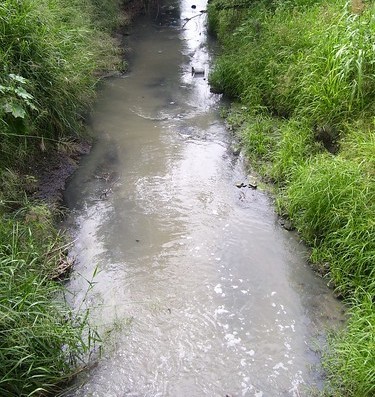 _Cloudy looking stream water, [Sustainable Sanitation Alliance](https://www.flickr.com/photos/gtzecosan/3027633774/in/photostream/), [CC BY](https://creativecommons.org/licenses/by/2.0/)_
_**METHODS:**_
##### Documenting visual changes in water color or clarity
+ [Photo documentation](https://publiclab.org/notes/gretchengehrke/09-18-2015/photo-documentation-of-turbid-waters-for-advocacy)
+ [Aerial photography](https://publiclab.org/wiki/aerial-photography) and satellite imagery
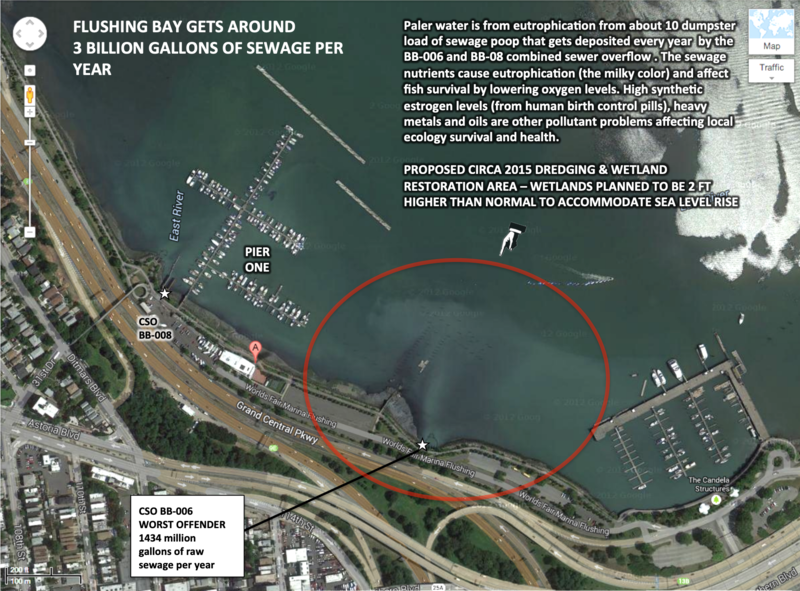 _Satellite image showing discolored, cloudy water in the Gowanus Canal. From [this slideshow](https://storage.googleapis.com/publiclab-production/public/system/images/photos/000/003/335/original/2014_3_17_Flushing_Bay_Water_Quality_Study_Notes.pdf) by @eymund._
##### Documenting changes in water color/clarity with spectral imagery (might not be visible to human eyes)
+ [Infrared balloon image reveals Gowanus plume](https://publiclab.org/notes/liz/8-3-2011/ir-reveals-gowanus-plume), and note [this comment](https://publiclab.org/notes/liz/8-3-2011/ir-reveals-gowanus-plume#c9960) that the plume is likely flowing sewage sludge that shows up in the near-infrared range because of the bacteria and small algae in the sludge.
+ Multispectral analysis of satellite images: like in the paper, “[Tracking stormwater discharge plumes and water quality of the Tijuana River with multispectral aerial imagery](http://oceani.com/PDF/Tracking%20stormwater%20discharge%20plumes.pdf),” by Svejkovsky et al. 2010.
 _Visible and near-infrared photos composited to reveal a plume of flowing sewage scum, originally from [this note](https://publiclab.org/notes/liz/8-3-2011/ir-reveals-gowanus-plume) by @liz._
##### Measuring turbidity of water
Solid particles floating throughout the water (called suspended solids) increase its turbidity. Learn more about turbidity in [this research note](https://publiclab.org/notes/anngneal/12-08-2017/7-ways-to-measure-monitor-and-evaluate-water-quality#7.+Assessing+the+Turbidity,+TSS+and+Clarity) from @anngneal.
+ The [turbidity wiki page](https://publiclab.org/wiki/turbidity) has a list of sensors and other tools that enable physically measuring turbidity
+ [Question: How do I choose a method for monitoring turbidity?](https://publiclab.org/questions/stevie/03-21-2018/how-do-i-choose-a-method-for-monitoring-turbidity)