 ##What is NDVI? What is NRG?##
We've been working a lot on capturing infrared imagery, and producing NDVI images such as the one above.
What are these images we're trying to make? What do they tell us about vegetation, and why? These diagrams should help to understand what it is we're doing and why these are good ways to analyze plant life.
##What is NDVI? What is NRG?##
We've been working a lot on capturing infrared imagery, and producing NDVI images such as the one above.
What are these images we're trying to make? What do they tell us about vegetation, and why? These diagrams should help to understand what it is we're doing and why these are good ways to analyze plant life.
 See, plants use visible light (mainly blue and red light) as 'food' -- not so much green light, which is why they reflect green away, and look green to our eyes. They also happen to reflect near infrared light (which is just beyond red light, but not visible to the human eye). This is because they chemically cannot convert infrared into useable food, and so they just bounce away to stay cool. The above image shows what colors of light plants absorb vs. reflect away.
By using this unique property of plants, plus our ability to take [near-infrared photos](/tool/near-infrared-camera) we can create composite images which highlight where plants are and how much they are photosynthesizing.
See, plants use visible light (mainly blue and red light) as 'food' -- not so much green light, which is why they reflect green away, and look green to our eyes. They also happen to reflect near infrared light (which is just beyond red light, but not visible to the human eye). This is because they chemically cannot convert infrared into useable food, and so they just bounce away to stay cool. The above image shows what colors of light plants absorb vs. reflect away.
By using this unique property of plants, plus our ability to take [near-infrared photos](/tool/near-infrared-camera) we can create composite images which highlight where plants are and how much they are photosynthesizing.
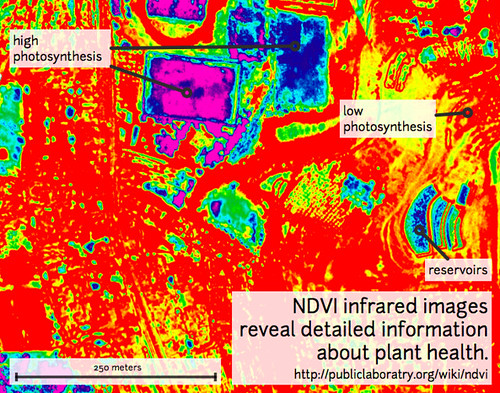
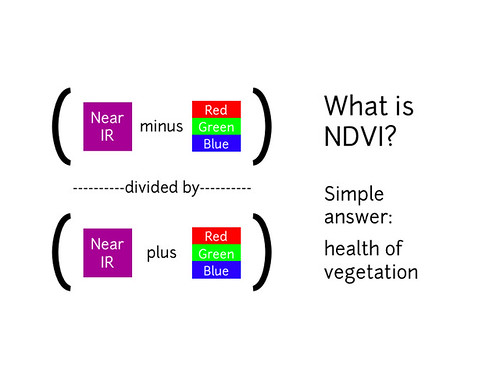 NDVI is a ratio which emphasizes plant health. The above equation is run for every pixel, using source data from an infrared photo and a visible light photo, [like this pair](https://www.flickr.com/photos/jeffreywarren/5390895115/).
The result can be false-colored to make the high-photosynthesis areas more clear -- like the top image on this page -- and used to examine where plants are and how healthy they are.
##NRG imagery##
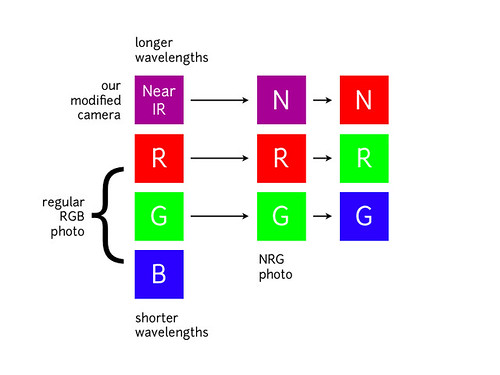
We're also interested in producing NRG imagery, where Near-Infrared, Red, and Green are used to compose a picture instead of the usual Red, Green, and Blue. This diagram explains the swapping, which allows us to 'see' infrared as if it were a normal color:
NDVI is a ratio which emphasizes plant health. The above equation is run for every pixel, using source data from an infrared photo and a visible light photo, [like this pair](https://www.flickr.com/photos/jeffreywarren/5390895115/).
The result can be false-colored to make the high-photosynthesis areas more clear -- like the top image on this page -- and used to examine where plants are and how healthy they are.
##NRG imagery##
We're also interested in producing NRG imagery, where Near-Infrared, Red, and Green are used to compose a picture instead of the usual Red, Green, and Blue. This diagram explains the swapping, which allows us to 'see' infrared as if it were a normal color:
 In NRG images, the deeper and clearer the red color, the denser and healthier the vegetation (more or less). Here is an example of an NRG image:
