It's easy to add your [MapKnitter](https://mapknitter.org) exported map as a background layer when editing OpenStreetMap. This wiki page explains how to connect to Potlatch 2 and iD editor. There is also a case study of an earlier method at bottom.

###Potlatch 2###
With help from Andreas Trawoeger from the OSM-talk list, we set up a "deep link" underneath the _Export formats_ area, so you can open your map directly in OpenStreetMap's Potlatch 2 editor by clicking "Use your map to contribute to OpenStreetMap in Potlatch":
**Note:** this is only available for maps which have been released under open licenses, such as CC-BY or public domain.
###iD Editor##
In Mapknitter.org, there is a "deep link" underneath the _Export formats_ area so you can click "Use your map to contribute to OpenStreetMap in iD". This will open the iD editor hosted on openstreetmap.us.
Manual method for adding a TMS layer on openstreetmap.org: you can click the Edit tab, choose the iD editor, then click the background tab to add a custom layer. The URL you paste in will be formatted like this: https://mapknitter.org/tms/2011-7-31-brooklyn-gowanus-vis/alt/{z}/{x}/{y}.png


----
###Old technique (no longer necessary)###
In this example I'm using [a map of Mestia, a city in the Svaneti region of Georgia](https://mapknitter.org/map/view/mestia).
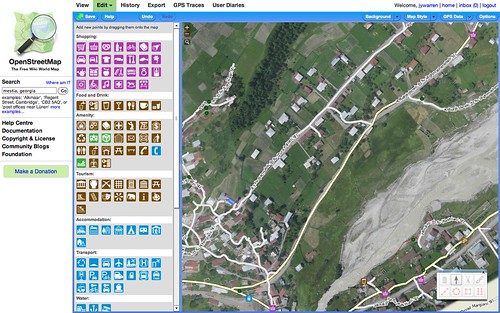
First, open the "backgrounds" menu and choose "Add":
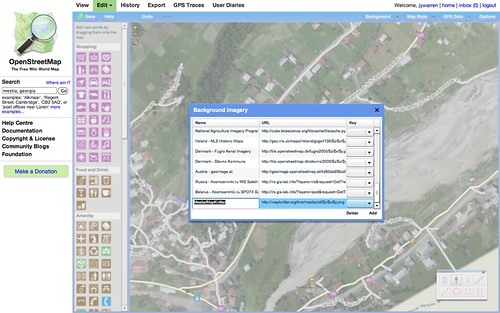
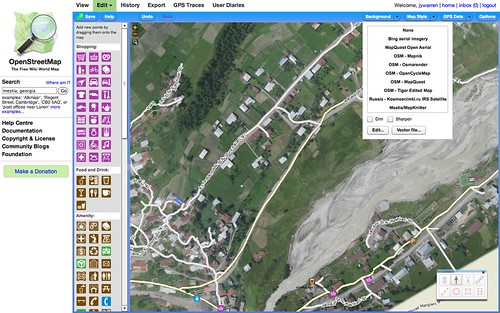 Then, add a new background layer, using your map's "**OSM-style TMS**" link, with added z,x,y like this:
https://mapknitter.org/tms/mestia/alt/$z/$x/$y.png
Where "mestia" is your map's name. See screenshot:
Then, add a new background layer, using your map's "**OSM-style TMS**" link, with added z,x,y like this:
https://mapknitter.org/tms/mestia/alt/$z/$x/$y.png
Where "mestia" is your map's name. See screenshot:
 You can turn off "dimming" to see the map more clearly:
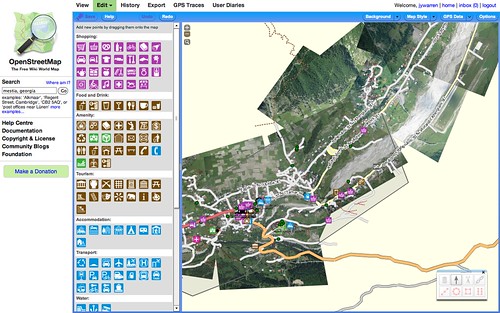 Zoom in and see how well your balloon map fits existing data. Then trace to add more features: