*This page introduces the scientific background of NDVI and its application to the [PLOTS visible/infrared camera tool](/wiki/dual-camera-kit-guide).*

Figure 1. The absorption of different wavelengths of visible light by photosynthetic pigments and the resulting spectral response of photosynthetic rate. Leaves appear green because the pigments do not absorb green wavelengths and reflect them all back for us to see. Modified from [here](http://en.wikipedia.org/wiki/File:Par_action_spectrum.gif)
Vegetation is green because plant leaves reflect green light -- they don?t use it for photosynthesis (Figure 1). Instead they use almost all of the blue and red wavelengths in sunlight. The pigments in leaves absorb this light to power photosynthesis which converts CO2, water, and nutrients into carbohydrates (food). In general, you can estimate the productivity or vigor of vegetation by how much blue and red light it is absorbing. Photosynthetic pigments do not use the longer, invisible wavelengths of infrared light and reflect almost all of it away (this helps prevent the leaves from overheating).
About a year after the launch of the first Landsat satellite in 1972, scientists began using the data from its sensors to estimate the productivity of vegetation by comparing the amount of red light reflected (there is not much from healthy plants) to the amount of near infrared light reflected (there is a lot). The amount of infrared light reflected from vegetation is a good indicator of how bright the sunlight was at any moment (leaves reflect all IR), and comparing that to the amount of reflected red light can tell us what proportion of the sunlight was being absorbed by the plants.

Figure 2. The equation for computing NDVI, the Normalized Difference Vegetation Index.
That relationship is a good measure of the amount of photosynthetically active biomass. They quickly settled on an index of plant productivity called NDVI for Normalized Difference Vegetation Index. Instead of just using the difference between the amounts of red and near infrared light, they normalized that difference by dividing it by the total amount of red plus infrared light (Figure 2). That allowed the index from different areas and different times of the day or year to be compared with each other.

_Figure 3. The width of the red and near infrared bands sensed by different satellites and used to calculate NDVI. The earliest satellites are to the left. At far right are the approximate bands captured by the visible/IR camera pair developed for the PLOTS KickStarter campaign. Data from [here](http://rangeview.arizona.edu/Glossary/ndvi.html) and elsewhere._
It was soon demonstrated that NDVI was a pretty good proxy for vegetation health or the amount of photosynthetically active biomass. Dozens of subsequent satellites have returned data about the red and near infrared light reflected from Earth?s surface, and for 40 years NDVI computed from these two bands has been a standard way of describing vegetation health or productivity. Over the years, the exact bands of wavelengths used to compute NDVI differed from satellite to satellite (Figure 3), but the index remained a fairly robust indicator of primary productivity. The most recent satellites sense relatively narrow bands of red and near infrared light.

Figure 4. A Bayer filter array allowing each pixel on the silicon sensor to record information from either red, green, or blue light.
It is possible to produce a good approximation of NDVI by using a normal consumer grade digital camera to capture visible light (including red), and another similar camera modified to capture only near infrared light. Silicon sensors (both CCD and CMOS) are more or less equally sensitive to all visible wavelengths, but by themselves cannot distinguish among different colors. So red, green, or blue filters are placed over each pixel to record information about just one color (Figure 4). An algorithm then assigns information about all three color channels to each pixel in the image file.
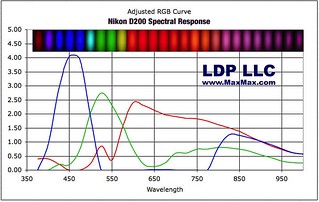
Figure 5. The spectral sensitivity of a typical silicon sensor with the IR block filter removed. All three color channels include some information about infrared light (wavelengths greater than 700 nm). Source: http://www.maxmax.com/spectral_response.htm
Unlike the human eye, the silicon-based sensors in digital cameras are sensitive to both visible and near infrared light (Figure 5). To prevent infrared light from being recorded in standard digital cameras, a filter opaque to IR is placed in front of the sensor. The resulting color sensitivity of digital cameras mimics human vision (Figure 6). Photo manipulation software can isolate the red channel in a digital image file and use it to compute NDVI.
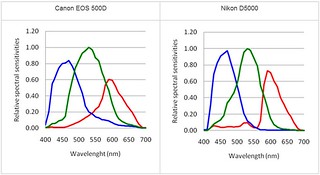
Figure 6. ?Typical spectral sensitivities of digital camera sensors with an IR block filter in place. The three colors are recorded separately in ?channels,? and each can be used individually. Information about infrared light is not included in any channel. ?The red channel often includes some information about green light (530-600 nm). Source: http://www.dxomark.com/index.php/Publications/DxOMark-Insights/Canon-500D-T1i-vs.-Nikon-D5000/Color-blindness-sensor-quality
By opening up the camera, removing the IR block filter, and replacing it with a filter that blocks all visible light but passes IR light, a consumer grade digital camera can be made to record only near infrared light. Inexpensive material suitable for such a filter is exposed and developed color negative film (Figure 7), or unexposed developed color slide film. The PLOTS IR cameras had small rectangles of color negative film placed in front of the sensors. Any one or any combination of the color channels from this camera could be used for near IR information, although more IR light seems to be available to the red channel.
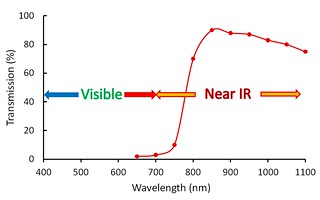
Figure 7. Spectral transmission of exposed and developed Kodacolor negative film. All visible light is blocked, and most near infrared light passes through. This type of filter replaced the IR block filter in the Canon A495 cameras modified for the PLOTS KickStarter campaign. Data from: http://www.northcountryradio.com/Articles/irfltr.htm
An early goal of work with the PLOTS infrared camera kit is to learn how interpretable its version of NDVI is. Figure 3 suggests that the red and IR bands produced by the cameras are wider than the satellite bands commonly used. The red band probably extends into the green wavelengths (which plants reflect along with IR), which could complicate the interpretation of the NDVI values. There may also be some overlap of the red and IR bands, although the exact spectral response of the normal and modified Canon A495 cameras is not known. Maybe the PLOTS spectrometer can be used to determine the width of the bands being captured by the cameras.
To compute NDVI, information about red light reflected from vegetation (recorded by the normal camera) must be combined with information about reflected near IR light (recorded by the modified IR camera). This must be done for the same patch of vegetation, and ideally for each pixel in the pair of rectified images. Rectifying the two images (aligning them on top of one another) may be impossible to do perfectly, so each image could be downsampled (adjacent pixels are combined and their color information averaged). That will reduce the chance that the calculation of NDVI uses red data from one area of vegetation and IR data from another area, a situation which could produce meaningless values.
When two images of the same scene (one with a visible red channel, and one with a near IR channel) are ready (downsampled and rectified), photo manipulation software (Photoshop, GIMP) or image analysis software (ImageJ, Fiji) can be used to compute NDVI using the brightness values of red and near infrared light for each stacked pixel pair. The resulting new image can represent more productive vegetation with distinctive colors and make it possible to detect patterns of spatially varying plant vigor in the scene. By repeating the mapping process at different times, it is possible to detect changes in plant vigor over the seasons or from year to year.