As referenced in a previous Note: http://publiclab.org/notes/stoft/05-14-2013/in-search-of-spectrometer-measurement-and-calibration , here are some observations on adding external attenuation for the spectrometer's incoming light. As most have probably observed, it is difficult to adjust the light level to provide a strong signal while avoiding RGB saturation.
These observations all show the relative signal change when adding attenuation. A "reference level" is first established and then attenuation is added while looking for decreasing signal strength.
Neutral Density DSLR Filter An adjustable neutral density filter was placed a few inches in front of the spectrometer's input slit and the relative spectral attenuation curve was captured for each of a series of 5 arbitrary attenuation filter settings.
DSLR ND Filter Relative Attenuation:

Notice that simply adding the ND filter produces a transmission response which is clearly quite variable with respect to wavelength. This is not one of the really expensive ND camera filters so non-uniformity is expected. However, note that the curves all have similar shapes. It seems that ND filters have a flatter response from 400-600nm but then peaking at ~700nm. The response plotted here is similar. The obvious question is how the filter response would be calibrated.
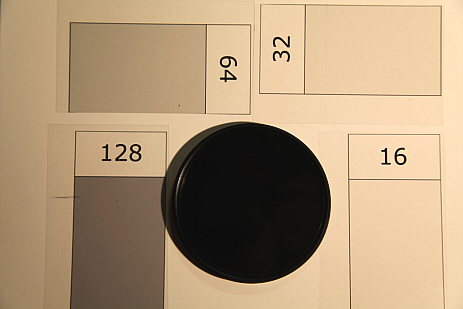
Transparency Film Attenuators Purchasing an expensive ND filter is probably unwarranted for a relatively inexpensive device which is still in development. As a cheap alternative, grey-shaded rectangular areas of InkJet transparency film were printed. The image pattern was created at 600dpi and printed in random-dithering mode for uniformity and the "pattern area colors" were all shades of grey. 8-10 patterns can easily be printed per sheet.
The printed transparency attenuators have the advantages that they are cheap to make and can be "stacked" in combinations and the attenuation values repeated "by the numbers". The downside is again, calibration. At a single wavelength, like ~600nm, a preliminary set of transparency filters appears to show a linear attenuation. In this plot, grey values were referenced to 128 and attenuators of 8, 16, 32, 64 and 96 were added to get variable attenuation settings.
Printed-Transparency Relative Attenuation:

Other Observations: 1) Neither inexpensive (~$40) DSLR ND filters nor cheap transparency filters have a flat transmission response vs wavelength. 2) For use with this webcam spectrometer, the DSLR ND filter has no clear measurement advantage. 3) Attenuation filters do make setting light levels (to maximize signal and avoid RGB saturation) much easier. 4) No single attenuation is sufficient -- a range of attenuation, to mix-n-match, helps. 5) Amplitude calibration remains a difficulty; even with attenuators.
Dynamic Range and SNR remain a significant issue for the spectrometer but Printed Transparency attenuators might provide cheap means for making measurements easier. However, these are only preliminary results and only represent a starting point.
Cheers,
Dave
Added: 5/15/13 A set of attenuation curves using "known" values could provide some view to system linearity with respect to wavelength. So, a set of Transparency Attenuators were printed with a range of value (16,32,64,128,192) representing specific grey-scale density. If the system is linear, then plots of transparency grey-scale vs measured signal amplitude change should show straight lines even if the sensitivity is wavelength dependent.
So, the signal level change was obtained and the data re-plotted. Notice that this plot looks very similar to the ones above and shows the change in sensitivity over wavelength.

Now, for every 50nm over the 300 to 800nm range, the measured signal attenuation is plotted against the transparency attenuator value.

Note that there is reasonably consistency in an approximately linear response of the system -- enough so, that I suspect that any non-linearity is not the imager chip but results from a variety of other factors. Transparency film is certainly not equally transparent at all wavelengths, but being extremely thin, those effects are minimized.
Suggestions for printing transparency attenuators: 1 - Use 600 dpi for the image 2 - Use the finest print resolution and use the dithering print setting 3 - Grey levels below 8-16 are of little use 4 - Use increments of 16 or above 5 - Grey levels above 192 may not print uniformly - it would be better to double-up
Dave
14 Comments
Hi, Dave - very interesting... is this fairly related then to the suggestion of an "HDR" neutral density filter where we could get 0/25/50/75/100% light and achieve both ideal exposure for any wavelength as well as a plot of linearity of the sensor response?
Also -- an optically interested friend suggested using polarizer film at different angles to achieve varying amounts of neutral density filtering. That could be a relatively expensive technique if it is even across wavelengths, but I don't know that much about polarizers.
Is this a question? Click here to post it to the Questions page.
Reply to this comment...
Log in to comment
Jeff, Thanks. I've just posted an addendum at the end of this research note to add some plots specifically looking for linearity. I believe the image sensor is, in fact, linear (assuming the chip exposure is stable at whatever level -- max gain I believe). I also believe that the anomalies I see are artifacts of a combination of other issues -- namely the system "un-flattness" for lack of a better term -- plus the overall "un-flattness" of the system response to be understood.
Besides the very low cost, the print-transparency attenuators have the advantage of fixed attenuation values. So, if we assume linearity, then fixed attenuation provides more value for measurement ... in addition to just preventing signal overload. (There is another, simple method for gross-level attenuation of a source like an incandescent lamp -- just place a cardboard baffle with a slit (like 1/8-1/4-in wide) in front of the lamp. This also cuts down on stray light and reflections.)
On using fixed attenuators. For example: You were attempting to observe fluorescence in the presence of a vary large signal where the wavelengths were well separated. If you use a fixed attenuation to keep the source signal from saturation (then record it's peak) and then remove that known attenuation and record the peak of the target signal, you have (theoretically) a measure of the difference -- whose value is greater than the dynamic range of the image sensor itself. The non-uniformity of the sensor vs wavelength might still be an issue -- I just don't yet understand why the system exhibits so much variance. A fixed attenuator can be roughly "calibrated" for any single wavelength of interest by providing a strong, non-saturating signal at that frequency (from any source) and then inserting a fixed attenuation (but while keeping the signal above the noise). The measured difference, at that target wavelength, is now the calibration for that attenuator for that wavelength.
ND filters are just a pair of polarizing filters -- one mounted the revers of the other so that 180-deg rotation goes from a min to max attenuation that is continuously variable. Good for photography but w/o fixed "known" settings of attenuation. Unless there is an additional way to calibrate them, they become less useful for amplitude measurements. I think there are fixed-value filters, but that would really multiply the cost.
Dave
Reply to this comment...
Log in to comment
Hi, Dave - I was thinking that given the propensity to take clipped data in almost all devices out there, what if we printed a whole bunch of these varying-attenuation transparency masks, with, say, two stripes of 50% with an open area between them, and distributed them to folks to see if we can significantly reduce clipping. We can ask people to tag their spectra with "masked" or something, and we can even make the widths of each strip unique integer distances, so the mask pattern can be auto-detected like a simple bar code.
What do you think?
Is this a question? Click here to post it to the Questions page.
Reply to this comment...
Log in to comment
I'd agree that giving more visibility the the clipping issue would be good and this is a simple, cheap tool. However, I don't quite follow your 2-strip and auto-detection scheme.
The attenuator covers the entire light path (which is only the size of the slit). I suppose a atten-clear-atten pattern (blocking the slit width into 3 bands) would show in the "swath" of spectral color (top 1/3 darker, mid 1/3 brighter and bot 1/3 darker) ... except I suspect users would naturally just pick the middle and have clipped data as usual. Maybe I missed your point.
The other issue is that the amount of attenuation will be different for every case. Just changing the distance to the source has a significant effect.
How about an 8.5x11 sheet of various attenuator values -- then, when there is clipping, select an atten to add -- one of them will at least be closer to max w/o clipping. A variable-grade atten could be printed though when you want repeatability, it's hard to know the atten 'setting' and return to the same value.
Dave
Reply to this comment...
Log in to comment
I guess I'm suggesting that with a 50/0/50 attenuator, although users may pick the middle naturally (as will the current auto-detection algorithm which -- for uploads -- picks the brightest row), we could put in a filter which autodetects clipping and either a) suggests to the user that they pick a different line (at capture time or in post-processing) or automatically scans the source image for data which is not clipped (which could also happen at capture time or analysis time). What about something like that?
Is this a question? Click here to post it to the Questions page.
Reply to this comment...
Log in to comment
Ok, interesting idea. The extension to this is a continuously variable attenuator and let the detection algorithm pick the line w/max signal but w/o clipping. When the phase grating is off a bit from orthogonal, the line of pixels is actually viewing non-uniform light exposure just due to the inaccuracies of the slit. However, maybe given all the contributions of smaller errors, a continuously graded attenuation, with center zero, over the length of the slit might work. Of course, the user would need to hold the device steady during capture.
Reply to this comment...
Log in to comment
I actually think there's an advantage to stepped grading, because
a) it's easier to pick out the pattern -- like a barcode -- vs. continuous change which could be for another reason like light against a receding wall
b) steps allow the device to average spatially to smooth sensor noise, without dipping into differently exposed data
Reply to this comment...
Log in to comment
I see your point. I just wonder about having only a single attenuation step which could make it difficult to find the best level; a case of too little or two much. Maybe a 4 step attenuator would help and still get 10 pixel lines or so per step.
Don't know the present algorithm used, but I found that averaging multiple frame data (same pixel line) to be more effective than averaging parallel pixel lines. I think this is because a large noise component is likely at a relatively low frequency and so be averaged out whereas parallel lines will all exhibit the same variation within a frame.
Reply to this comment...
Log in to comment
Thinking about how to do this well... did you print on a laserprinter? Can you run transparency through one of those? Would inkjet work, or would it smudge?
If this works well, we could have a printer run off a huge # of them and start shipping them in all the kits. For now, it'd at least be great to send one to those NASA folks trying to scan flares, and anyone else on the list who wants one. If we can hammer out a prototype design, I can arrange to have them shipped from our fulfillment center in Portland.
Is this a question? Click here to post it to the Questions page.
Reply to this comment...
Log in to comment
Yes, I ink-jet printed on 'Grafix' transparency film (not the adhesive version)-- it's available on-line via Amazon. It's reasonably stiff in small pieces and you could print many per sheet and keep the cost very low. The filter graphic is at 600ppi and printed with dithering turned on (Canon Pro9000) to keep print dot resolution fine and overall grey shade uniformity. Yes, as the shades get darker (so there is more merging of dots, the dry time increases but for medium attenuation, I let them sit for an hour or so. I did not do cure-time testing so it might be faster than that for what you want to print.
Reply to this comment...
Log in to comment
I actually don't have an inkjet printer; would you be at all interested in printing a few sheets of this and mailing it to me? I could then cut it up and mail it to anyone who asks. Otherwise I can search around for one, or see if its possible to print on transparency with a laser printer.
Is this a question? Click here to post it to the Questions page.
Reply to this comment...
Log in to comment
Aha! http://www.amazon.com/3M-3700-Color-Laser-Transparency/dp/B00004TS5M/
I'll order this now; maybe drying won't be a problem with a laser printer; also I wonder if resolution will be higher?
Is this a question? Click here to post it to the Questions page.
Reply to this comment...
Log in to comment
Yes, I could print a couple sheets but it would be best to decide on the best pattern and density if you're looking to send something along the lines of your 50-0-50 concept.
Just a guess, but I suspect you won't get the same results with a laser printer. Lasers are extremely high contrast so designed for layout graphics and text, not photographs. The inkjet is capable of printing at 2400 dpi which means it creates very high tonality resolution -- which is why it is good for photographs. Since the camera is focused on the slit and the filter is also located there, the neutral-density filter needs to be uniform at any grey level -- i.e. not something the camera can focus on as an image.
Any additional thoughts on pattern layout, form-factor and density for cut-pieces to send out for Alpha testing?
Is this a question? Click here to post it to the Questions page.
Reply to this comment...
Log in to comment
I think if we do something with a few more lines, as you say, we can try it out. Say, 75-50-25-0-25-50-75, each band being about a 1/4" wide. If you could just print a very long set of bands, I can just chop it up into slices for distribution. Let's try it out and we can iterate if it's not quite right. Cool.
Reply to this comment...
Log in to comment
Login to comment.