Background: Recently, I began a project to understand the relationship between the data publiclab.org website collects, the mechanisms of the collection process (the codebase), and the Public Lab community. The reason why I am curious about this is because while Public Lab is not the only website to collect community data (read: any ad supported website) in this case there are a few unique differences. 1) As a "research website" the very goal is to contribute data. The collection is not an incidental thing that happens because you're interacting with the site in a different way (e.g., commenting on articles from friends). 2) The very community that provides the data is the same community that informs and builds the infrastructure that collects it. Therefore, I believe it stands to follow that since there is an inherent relationship between the three (data, website, community), there aught to be a reflection of the community embedded in each aspect.
Purpose
In order to understand this relationship, I borrow a method from an article called Revealing Matrices written by Prof. Maximillian Schich. In the article, he argues for the need to analyze networks of data by starting with the way it is stored. This differs from other approaches as normally you simply piece the data together and go from there. However, the advantage of understanding the data as a database network first, is that it allows you to understand what is possible with the data. While the following example isn't the case with Public Lab, suppose you have an archive of art history data (as in the case he uses). You might have some fields missing. The model of a document might be different than that of a monument. Understanding the data as organized in the database, allows you to see what's possible.
Materials needed
1. An EER database diagramming program:
I used DB Diagram: No need to create an account (I didn't) although technically it's safer since you can save your diagram. Having said that, I just went to the site and it still pulled up my diagram even after a month since I used it. So, cookies or whatever I guess.
You can also use the free MySQL Workbench. I didn't use it because (as far as I can tell) it will only draw relationships between tables, not relationships between the exact property in the table and the one it points to.
2. A browser open to the schema.rb file from the plots2 GitHub repository:
Technically it's the technically schema.rb.example file. You don't have to download it (yet), just keep it open in a browser.
3. A browser open to the plots2 code repository models folder.
4. An SVG editor:
This is for part II of the activity. I'll be using Inkscape which is the open source version of Illustrator. You can also use Figma (you have to sign up, but there is an app that you then download).
Step 1: Locate schema.rb.example in Plots2 codebase
Go to the schema.rb.example file and click "raw". Alternatively, just click here which takes you to the raw version.
Step 2: Save file to your computer
Either a) save the webpage as a text file (Firefox automatically gives you this option when you save the page) or b) copy and paste the text into text editor such as the simple text editor that comes with your computer (in OSX this is called "textedit"). Fancier text editors will do as well. As long as the file is saved as a .txt file. Then go into your file manager (e.g. Finder) and change the name of the file from "yourfilename.txt" to "yourfilename.db".
Step 3: Import schema.rb to dbdiagram.io
Now go to dbdiagram.io, click "import", and choose "Import from Rails

The wording the modal uses is a bit odd, but click on "Upload schema.rb:
Which will bring up the file chooser. Chose your file, and you should see this:
Step 4: Create EER database diagram
Here are some useful links from here on out:
SCHEMA: https://github.com/publiclab/plots2/blob/master/db/schema.rb.example
RAW TEXT: https://raw.githubusercontent.com/publiclab/plots2/master/db/schema.rb.example
RAILS ASSOCIATIONS: https://guides.rubyonrails.org/v2.3.11/association_basics.html
MODELS: https://github.com/publiclab/plots2/tree/master/app/models
OVERALL: https://www.holistics.io/blog/a-database-diagram-designer-built-for-developers-and-analysts/
RAILS: https://www.holistics.io/blog/visualize-rails-database-to-erd-diagram/
MANY TO MANY: https://www.holistics.io/blog/dbdiagram-io-many-to-many-relationship-diagram-generator-script/
Step 4a: Open up the files
All of the models are located in the models folder of the app folder. As an example, we'll will be working with the node.rb model. My approach was to work with the largest model to the smallest. Additionally, I also removed any models that I wasn't interested in. Here will be moving back and forth between the schema and the node.rb model.
The node section in the schema is on line 216 and the related code in the node.rb model is on line 84. You're always looking for the following. In the schema file, a block of text that starts with:
create_table "the_table", primary_key: "the_key", force: true do |t|
And the complementary block of text in the model file will begin with something like this:
has_many :revision, foreign_key: 'nid', dependent: :destroy
Usually the "has_many" part is at the top but in some cases such as the above you'll have to search a bit.
A good idea at this point is to open up the Rails Active Record Association guide, and the DBDiagram.io tutorial (scroll down to "Create relationships") section. I'd also open the "Help" panel on the web app which is in the upper right hand corner.
Now we can go about creating the relationships between the different tables.
Step 4a: Introduction to relationships.
While Rails has a few different types of relationships, DBDiagram only has three. If you're only interested in drawing the connections, then any of the following will work. If you're interested in being accurate, here's how it breaks down:Over in the help panel on the right, you can see a bunch of things you can do, such as adding primary key, not null, unique, etc. and aliases. There are also three different ways to create the relationship. I'll be using the short form. I like to keep them below each table, but you can put them anywhere you want. Here's how the Ruby associations translate to the DBDiagram ones:
belongs_to (one to one) -> Ref: table_one.field_one - table_two.field_two<br>has_one (one to one) -> Ref: table_one.field_one - table_two.field_two<br>has_many (one to many) —> Ref: table_one.field_one
Rails does not seem to use the concept of "many to one" but it's available if you just turn the arrow around. However, Rails does provide a "through" association which is really the connection of three tables.
They come in the following form:
has_many :table_two, foreign_key: 'key'<br>has_many :table_three, through: :table_two
The simplest way to do approximate this is:
Ref: table_one.field_one < table_two.field_one<br>Ref: table_two.field_two < table_three.field_one
I like to visualize the middle part so I do:
Ref: table_one.field_one < table_two.field_one<br>Ref: table_two.field_one - table_two.field_two<br>Ref: table_two.field_two < table_three.field_one<br>
// node.rb<br>has_many :images, foreign_key: 'nid' --> Ref: node.id < image.nid<br><br>// images.rb <br>belongs_to :node, foreign_key: ‘nid’ --> Ref: image.nid - node.id
Step 4c: Creating relationships
In order to keep it simple, we will work with node.rb, user.rb, revision.rb, node_tag.rb, and tag.rb because it will allow us to work with all of the scenarios that might come up. Additionally, I am removing some fields of the tables, again, to simplify them for the sake of example.
On the left hand side, where all of the tables are, delete everything except for the following:
Table "node" {<br> "id" varchar<br> "vid" integer<br> "type" string<br> "language" string<br> "title" string<br> "uid" integer<br>}<br><br>Table "node_revisions" as revisions{<br> "id" varchar<br> "nid" integer<br> "uid" integer<br> "title" string<br> "body" text<br> "teaser" text<br>}<br><br>Table "users" {<br> "id" varchar<br> "name" string<br> "pass" string<br> "mail" string<br> "mode" integer<br> "sort" integer<br>}<br><br>Table "community_tags" as node_tags{<br> "id" varchar<br> "tid" integer<br> "nid" integer<br> "uid" integer<br> "date" integer<br>}<br><br>Table "term_data" as tags{<br> "id" varchar<br> "vid" integer<br> "name" string<br> "description" text<br> "weight" integer<br>}<br>
This should leave you with the following tables in the visualization (I moved them around in these positions):
In node.rb, line 84 we see the following:
has_many :revision, foreign_key: 'nid', dependent: :destroy
First thing to notice is that it is asking for a "has_many" relationship with "revision" but our table is called "node_revision". If you open open up the revision.rb, you find that this is, in fact, the name of the table. In order to connect the two we'll make an alias by adding the following:
Table "node_revisions" as revisions{<br> ...<br>}
Note, the schema interpreter does not distinguish between the singual (revision) and plural (revisions) in the way that I think Rails automatically does, so I just choose the plural. Now we can add the relationship:
// node.rb, line 84: has_many :revision, foreign_key: 'nid'<br>Ref: node.id > revisions.nid<br>
You should now see a line from node.id to node_resvisions.nid. If you hover your mouse over either table, you'll also see the exact "one to many" relationships. Now, let's do "belongs_to":
// node.rb, line 97: belongs_to :user, foreign_key: 'uid'<br>Ref: node.uid - users.id<br>
Again, mouse over either table and you'll see a 1:1 relationship. This was a bit counter intuitive because following the pattern above, you'd think it would be node.id - users.nid. However if you look at user.rb, line 46, you'll see that it has a "has_many" relationship to a node. So, you could go either way.
Finally, let's look at the "through" on node.rb, line 87 and line 88:
// node.rb, line 87: has_many :node_tag, foreign_key: 'nid'<br>// node.rb, line 88: has_many :tag, through: :node_tag<br>
Two things to note:
1) In these "through" examples the "through line" doesn't tell us what key it should be. To figure this out, we can go to line 7 in the tag.rb model and see that the tags are connected to node_tags by 'tid'.
2) Again, those aren't the names of the tables in DBDiagram, instead we have "community_tags" and "term_data". However, they are the names of our model files node_tag.rb and tag.rb. Once again, we'll just make an alias.
Table "community_tags" as node_tags {<br> ...<br>}<br><br>Table "term_data" as tags {<br> ...<br>}
Option 1:
Ref: node.id < node_tags.nid<br>Ref: node_tags.tid < tags.id
You should now see a line from node.id to community_tags.tid, and then another line from community_tags.tid to term_data.id.
Option 2:
Ref: node.id < node_tags.nid<br>Ref: node_tags.nid - node_tags.tid<br>Ref: node_tags.tid < term_data.id
Similarly, you should see the same as above, except also a tiny loop from community_tags.nid to community tags.tid, like so:
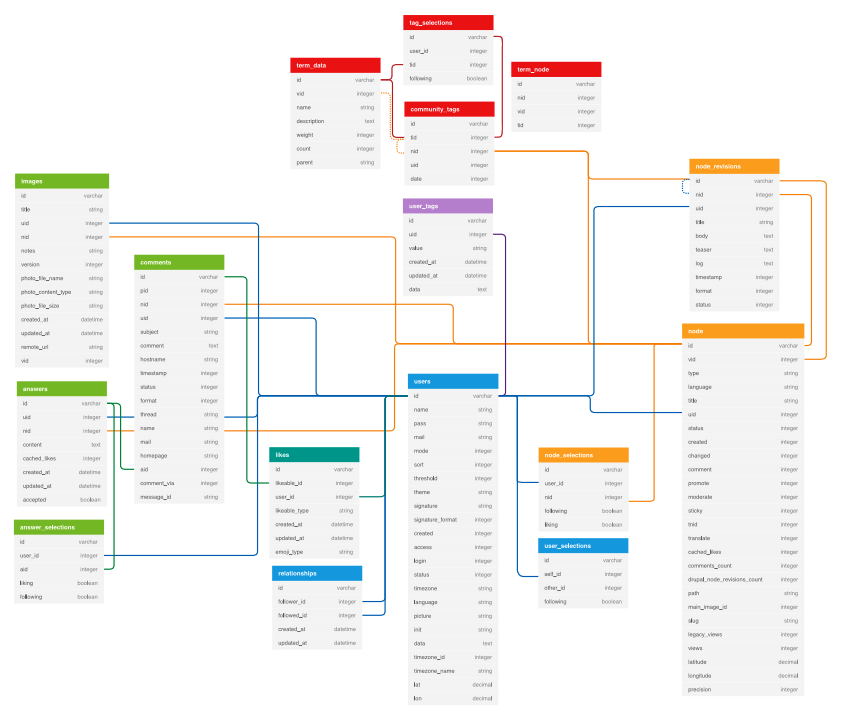
Finally, export your diagram as a PDF and save it for part II of this tutorial!
2 Comments
This is awesome Benjamin 🎉
Reply to this comment...
Log in to comment
How did you change the color of the header of your tables?
Is this a question? Click here to post it to the Questions page.
Reply to this comment...
Log in to comment
Login to comment.