This project is about conducting an Experiment to see if a PI NoIR camera is able to perform NDVI calculations.
An automated system has been built and the experiment is on week 2 out of 4. When it's finished results will be shared and hopefully I will be able to share my code.
Please leave any questions as a comment and I will be glad to answer them.
Starting this post where I will publish my findings.
Expect results in around 1-2 months since this work is part of my Bachelor Thesis in computer science at Malmö university.


.png")
1. First image is the raw image from camera with custom white balance using a blue filter.
2. Second image is the image without applied colormap. It can be considered as grayscale since its only 1 channel of 255 values.
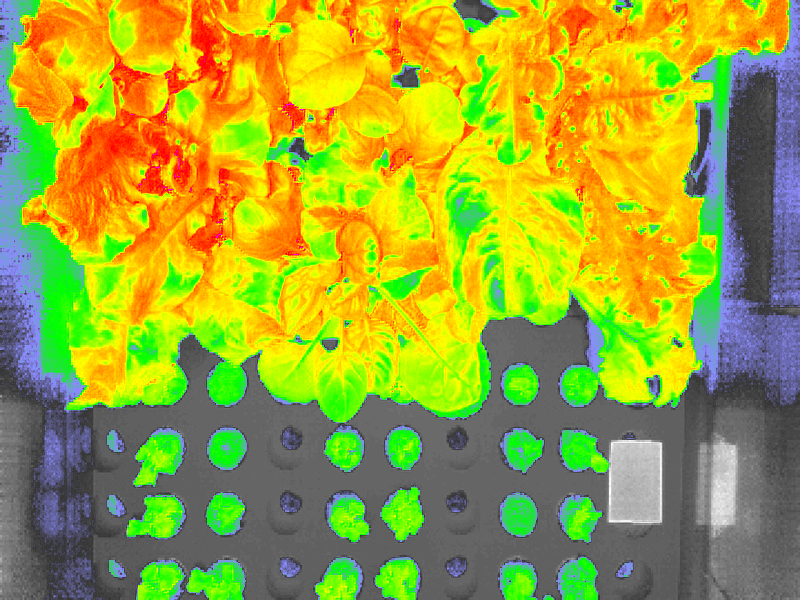
3. Third image is after a colormap has been applied. I'm currently using fastie's colormap.
Code is written in Python and fully automated process for collecting data. Pictures are taken 3 times a day.
As of now I'm scaling the images from 1920x1080 to 800x600 with Lancosz algorithm for interpolation. The reason being for noise reduction, smaller storage size and faster calculation time.
After processing the images on the raspberry pi I upload them to google drive.
I have tried to create a process for automated data collection to see if I can correlate NDVI values to values generated by the environment. If so one might be able to use NDVI values or another "color based index approach" for monitoring plant health [1].
Plants grown are from left to right Mixed Lettuce, Tatsoi, Australische Gele.
The experiment is conducted on the propagation stage of plants for Hydroponic farming.
Two separate containers has been setup with the same plants in both. The dependent variable is that a 3 part nutrient solution has been added since day one to one of the containers and I will plot differences in NDVI value between the two containers.
Checkout github repo here: https://github.com/PiddePannkauga/ndviMachine
Only intended for users who are comfortable with Python environment. Some editing of the code needs to be done to suit personal use but hopefully it will serve someone with ideas. I will look into adding better documentation but you can always reach me in the comment section here.
This graph represents the mean of NDVI values from each day during the experiment. One day is the composite of pictures taken at 6am, 12pm, 6pm. Only values between 0.28-0.9 are used since they tend to be plant pixels. Interesting results since I added nutrients from day 0 in one of the growboxes. From this graph it seems like the nutrient solution started taking effect from day 9 where the trend is shifting between the two growboxes.
Reference
[1] Esmael Hamuda, Martin Glavin, and Edward Jones. A survey of image processing
techniques for plant extraction and segmentation in the field. Computers and Electronics in Agriculture, 125:184--199, July 2016. **
**
20 Comments
This is fantastic! Looking forward to seeing your conclusions!
Reply to this comment...
Log in to comment
Hi! This is awesome. Have you seen our Infragram Pi software, somewhat documented at:
https://publiclab.org/infragram-pi
https://publiclab.org/pi-builder
We'd love feedback on this project for standardized and easy-to-use infrared pi software!
I was not aware of this. Very cool, I had an idea doing something of the same sort but it's better if we work together! I'd love to share what I've learned since I have gotten so much knowledge from this site.
Reply to this comment...
Log in to comment
that'd be awesome. The image workflow we've built is javascript based, but it's also possible to use Pi Builder to produce reproducible python toolsets. You can check out the JS workflow on these pages:
https://publiclab.org/image-sequencer
https://publiclab.org/notes/warren/08-02-2018/use-image-sequencer-for-ndvi-plant-analysis-with-a-modified-mini-sport-camera?_=1554828097
https://publiclab.org/notes/warren/05-30-2018/use-image-sequencer-for-ndvi-plant-analysis-with-2-images
https://publiclab.github.io/infragram/
On Tue, Apr 9, 2019 at 12:35 PM \<notifications@publiclab.org> wrote:
Is this a question? Click here to post it to the Questions page.
Reply to this comment...
Log in to comment
Wow, great work Peter! Have you not included the non-filtered image used to generate the single channel NDVI? or are you doing 'single image' NDVI using a special blue filter?
I'm working on a similar project, using python, rPi, a NoIR cam and I'm even targeting the propagation stage as my primary use case!
Thanks for uploading the single channel image! Now I can do some simple tests while I wait for my camera equipment to arrive (without having to reverse engineer the colormap lol)
I'd love to talk about implementation, possible improvements, and more.
-Jacob
Is this a question? Click here to post it to the Questions page.
Hi Jacob,
Cool! It would be interesting to compare ideas.
I'm taking a single image, using the blue filter that came with the NoIR camera module. I also set a custom white balance for blue and red channel to get the image for NDVI calculation.
Dang, nice! Didn't realize this was possible with the blue filter that ships with the piNoIR. I can't believe how clear these results are.
I'm also a computer science graduate, I'm interested in applying machine learning to NDVI (and other VI) images. I should have my setup put together in the next week or two, and look forward to posting my results here on publiclab.
Lol wish I had saved the blue filter it shipped with
Reply to this comment...
Log in to comment
Hi Peter,
What red/blue gains did you use for these photos (I assume you are using picamera)? I know that lighting conditions vary and white balance settings will vary as well but all my images are coming out completely washed and I've tried a few different settings.
Is this a question? Click here to post it to the Questions page.
Is this a question? Click here to post it to the Questions page.
I wrote a simple GUI application using TK for Python with 2 sliders to control AWB gains. That was my approach to finding a good balance. I don't think my settings will work for your environment since it depends on the amount of light present.
Here is my repo for the GUI application. Run the script on your raspberry pi. Think you need to install a Tkinter library. At first I only created it for personal use. It will give you error messages if it's missing a library so just install it using pip. I'm new to python so my fundamentals are quite there yet. https://github.com/PiddePannkauga/PiCameraGui
Thanks Petter, I'm using a headless Raspberry Pi so I don't have the option of writing a GUI application (without networking the stream and severely complicating things).
What I've done is written a script that takes a load of photos at different white balance settings to try and find the sweet spot.
I've got my new filter in now and my results are quite a bit better. I'm going to write a research note when I get things set up and I've taken a few rounds of photos.
I found your NDVI processing and it seems practically identical to mine, I hadn't used the vmin, vmax attributes of matplotlib to view the raw ndvi values (I had to truncate the negative values and scaled into 0-255 range), thats a nice trick that I'll have to try!
I use a combination of PILLOW, numpy and Matplotlib. You can also find all my camera settings in https://github.com/PiddePannkauga/ndviMachine. It might be abit of a mess but look in takePicture.py
Hi! Just noting that this software stack I mentioned above is configured to run headlessly and to send video over WiFi, including NDVI processing:
https://publiclab.org/infragram-pi
https://publiclab.org/pi-builder
Could be helpful!
Reply to this comment...
Log in to comment
This is awesome I am working on implementing this into analyzing my hydroponic garden. Just got my piNoIr camera running & am looking through your project. Thanks for writing this up!
Reply to this comment...
Log in to comment
Hi Peter, you explained that you used the GUI to manually find your proper balance, however how did you actually quantify what made a good photo?
Is this a question? Click here to post it to the Questions page.
Have you found your answer already or is there anyone else with a feedback on how to know when one found the best balance? :) pretty hard to find informations on this in the web.
@petter_mansson1 thanks a lot for this great intro into NDVI analysis! Hope to enrich my HPA system with this to get a better / shorter feedback loop on the settings of my system!
Is this a question? Click here to post it to the Questions page.
Reply to this comment...
Log in to comment
Hi @petter_mansson1 I can not use Cloud Upload in MainNDVI Thise error missing 2 required positional arguments : 'preNDVIFilepath' and 'timestamp'
Help me Pls 😔
Reply to this comment...
Log in to comment
@peter_mansson1
Nice work.
The final goal here is to analyze the nutrient effect. Right?
The normal camera (Raspberry pi camera) can also get this type of result. If we plot the total area covered by the plant vs days, we also get this type of graph. What is the extra information we get here using NoIR camera?
The Raspberry pi camera is cheaper than Raspberry pi NoIR camera.
Is this a question? Click here to post it to the Questions page.
Reply to this comment...
Log in to comment
Login to comment.