The aim of our research project is to examine thermal pollution at the Holyrood Thermal Generating Station in Holyrood, Newfoundland. Our specific site was the Cooling Water Outfall, which discharges directly into Conception Bay. We gained access to a thermal fishing bob, but could not get it working through troubleshooting. Instead, we decided to modify the thermal flashlight to see if we could test surface water temperature. We attempted to waterproof the casing, but will post a video later to show the difficulties associated with using this technology around water, especially in the Newfoundland climate.
The following notes and images are from our second site visit, the visit in which we collected most of our data.
Data collection on November 25, 2014 at Holyrood, NL:
We visited on Tuesday, November 25 and were there from about 1:30 to 3. It was a fairly warm day (around 12-13C) but the wind was very chilly. Our high reading was around 65F (by the second outflow) and our low reading was 53F (by the first outflow). We calibrated our thermal flashlight based on the first outflow, which ended up being the colder of the two.
Because it was day, we could only get still shots and were not able to produce very good data vis, but I made a rough map of what we accomplished and what we hope to accomplish next time we go out there.
Conditions: Around 13C, but the thermal flashlight read 25F (-5.56C) away from the water – it was an extremely windy day, so wind chill is a factor.
We calibrated our flashlight with a low temperature of 48F and a high temperature of 56F, though the range of temperatures we ended up finding was much greater than this.
Here are some pictures from our data collection and below them, we've made temperature maps to show where precisely the pictures were taken on our site:


No image for 6 on map Light = Red Temp = 63F (17.22C)
No image for 7 on map Light = Red Temp = 60F (15.56C)
Temperature Map of actual readings:
Hypothetical data visualization:

Temperature Map if flashlight calibrated more effectively:
Hypothetical data visualization: This is the kind of image we hope to capture on our next visit.

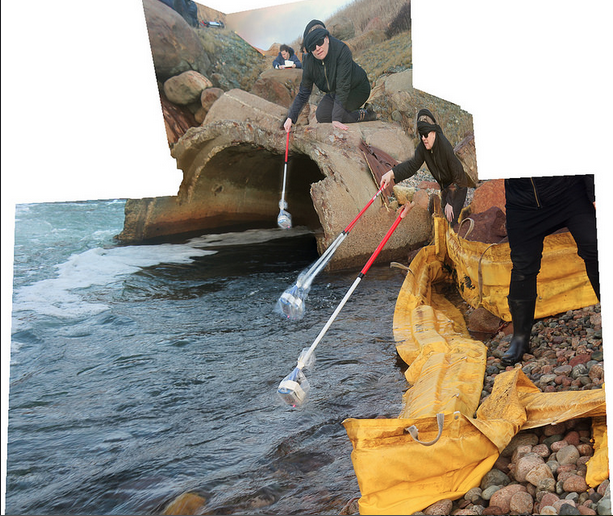
Composite picture of some data collection:

(It might be difficult to see, but the bulb is red. These pictures were taken around #4 and #5 on the maps above.) This composite image was the beginning of data manipulation to try to make our data more visible, but was not developed to its full potential because we later visited the site at night to try to get good pictures with the flashlight.
Nighttime visit to Holyrood: December 4, 2014
We are going to make another posting about this visit and it will contain a video and images that we captured. Should be up within the next day or two.
1 Comments
great route plans! really good pre-trip planning. awesome!
Reply to this comment...
Log in to comment
Login to comment.