NDVI is an index (a unit-free number) related to how much photosynthetic activity is occurring. A single NDVI value can be determined for an individual leaf or a 200 acre corn field. Or an NDVI value can be determined for every pixel in a photograph of a leaf or of a corn field. If you have a value for every pixel, you can assign different colors to different ranges of NDVI values and make a false color map of how NDVI varies spatially. You can use any color scheme you want, and I have been using one that turns images into "heat maps" of photosynthetic activity by painting high NDVI values with hotter colors. A long time ago, someone suggested that this type of color map was not helpful to people with red/green color blindness like protanopia.
.

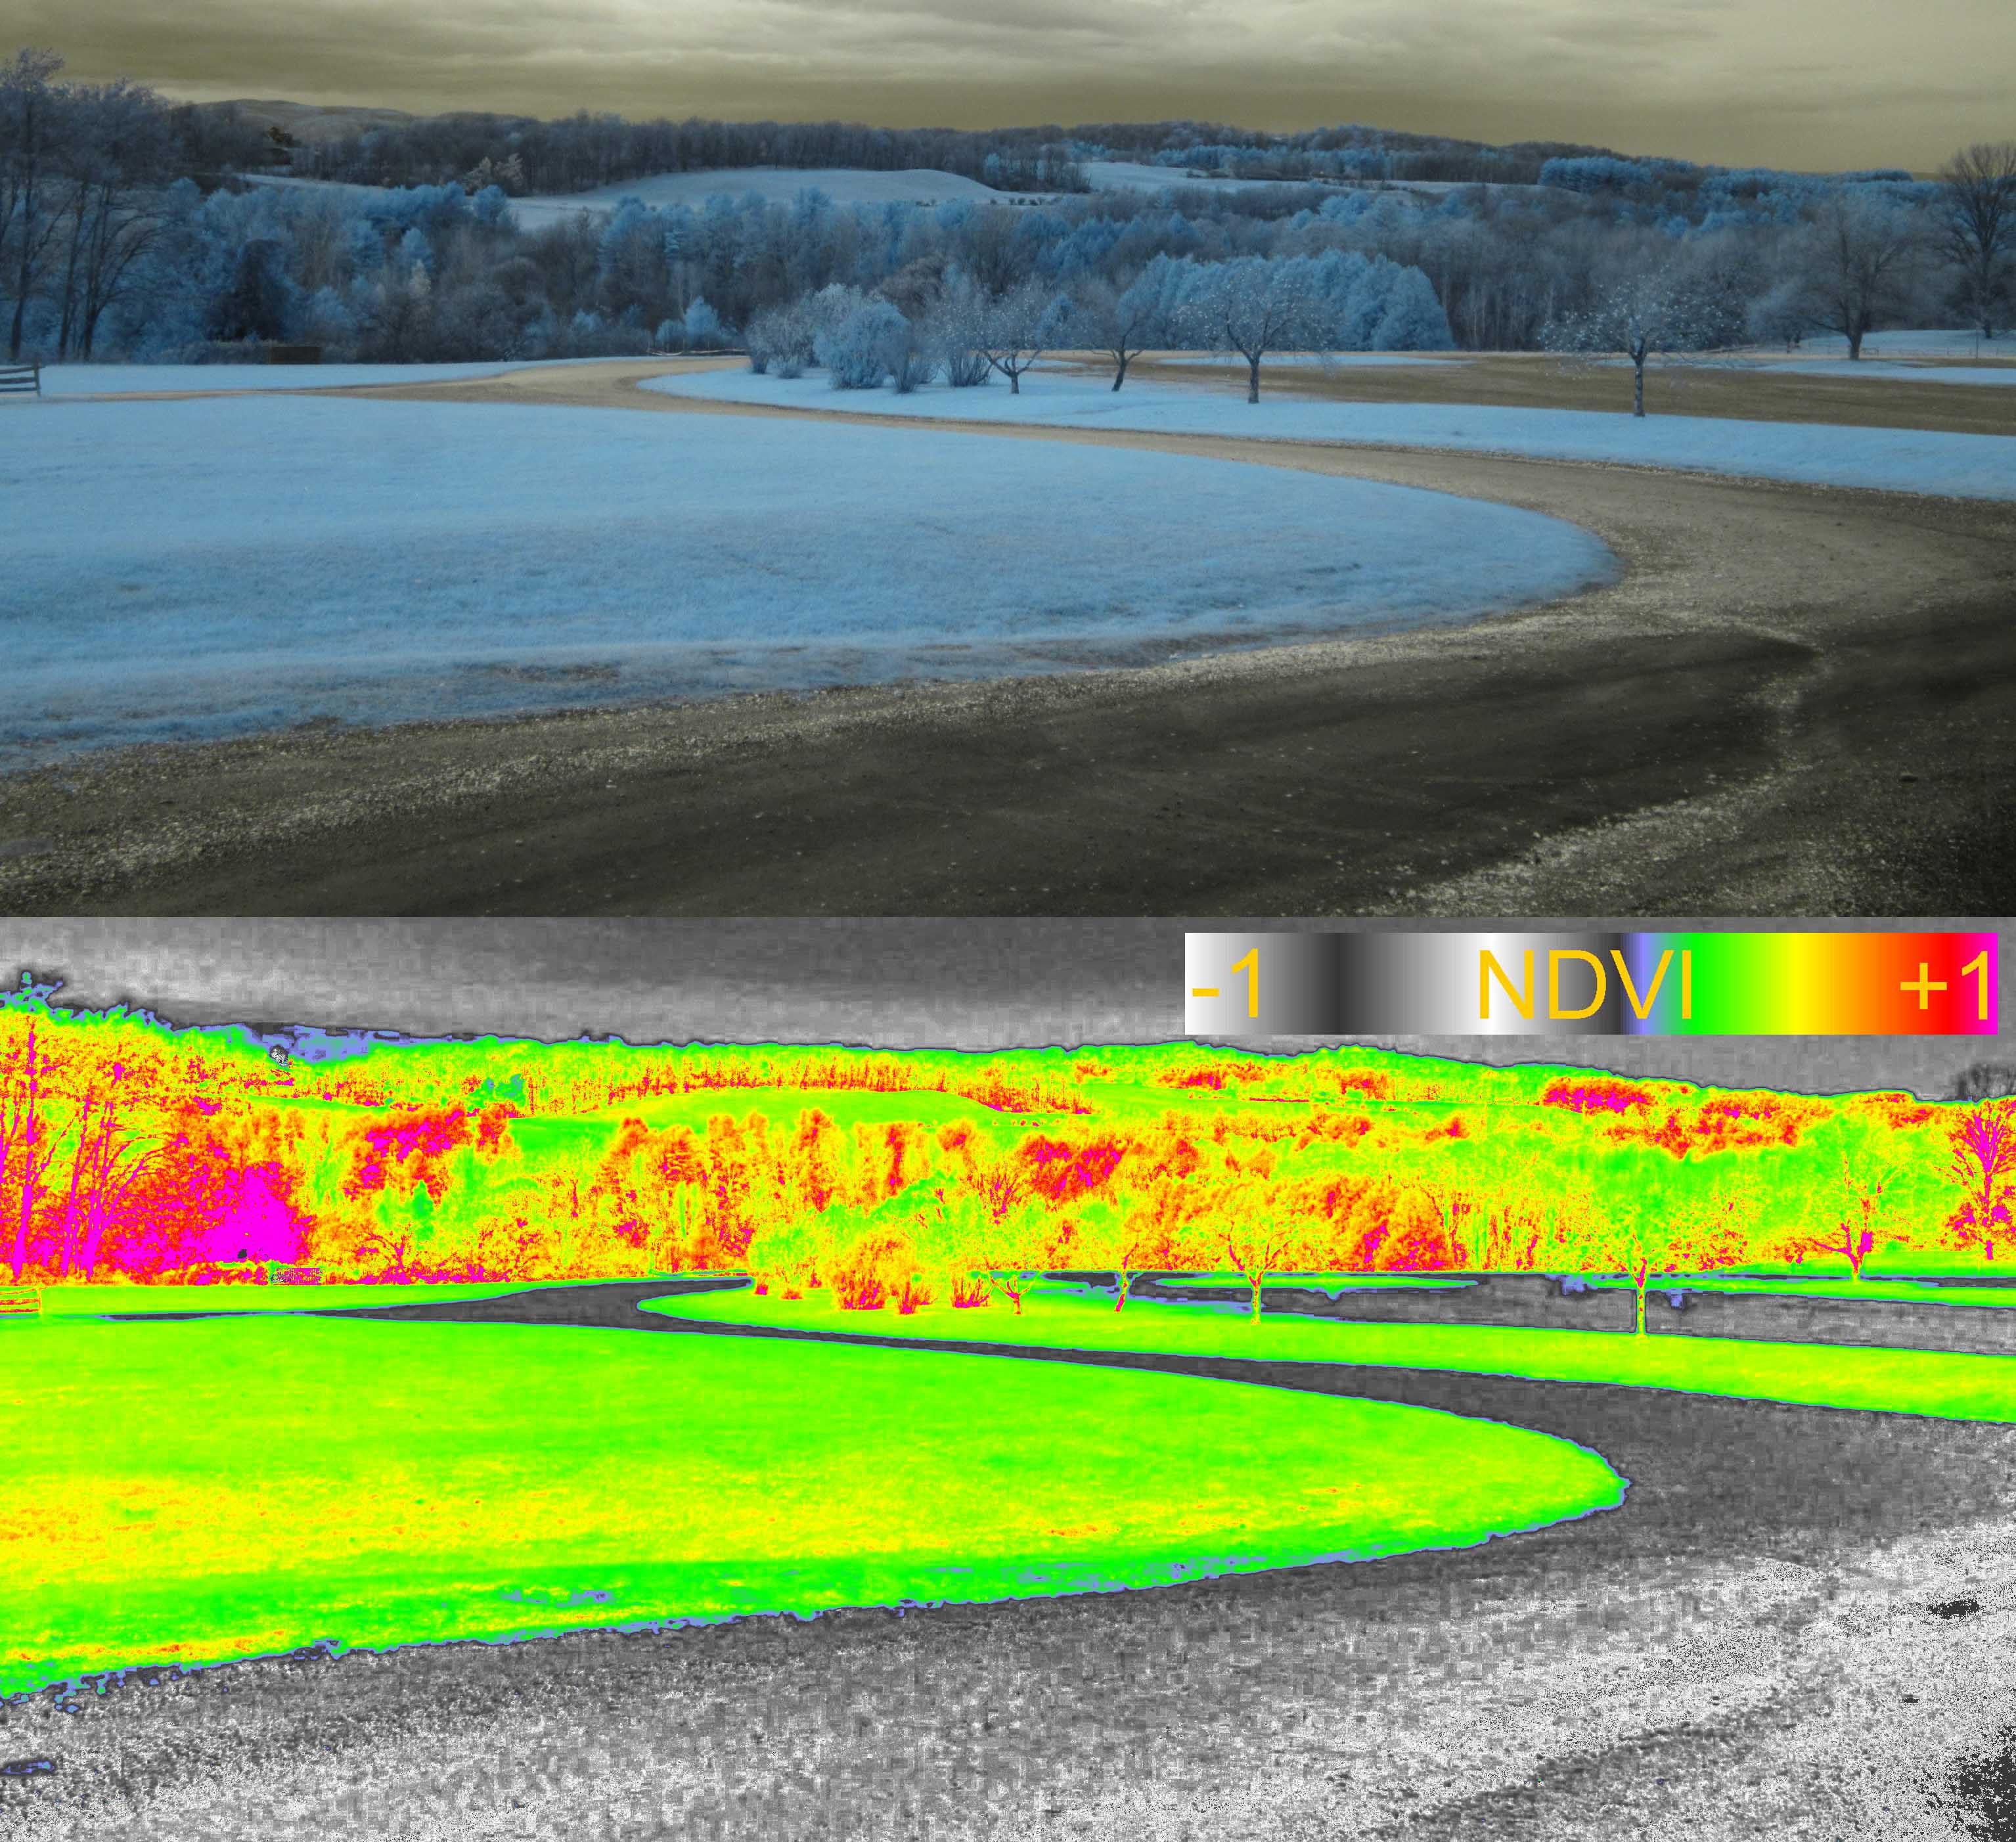
My standard color map for NDVI images (top), and how it looks to a person with protanopia (bottom). NDVI values below zero are assigned a blue color. NDVI values above zero are assigned colors on a gradient from green through yellow to red, so greater photosynthesis is highlighted with hotter colors. Protanopes see this gradient very differently.
.
There are lots of web sites which show you what a color photo looks like to a color blind person. Different sites produce slightly different results, but it is obvious that the eight percent of white men with color blindness (< 1% of white women have it) can't derive much useful information from NDVI images colored with this colormap. The problem is that red and green don't look very different to color blind people. So I made some colormaps which had only red or green but not both.
.

A colormap (upper) and how it appears to protanopes (lower).
.

A colormap (upper) and how it appears to protanopes (lower).
.
I was unable to find a color gradient that allowed color blind people to derive as much information as the rest of us. Without both red and green, it is very hard to find a gradient that would allow similar values of NDVI to be distinguished. There just aren't enough other colors. Maybe there is a trick I am missing, but I gave up. Sorry bros. NDVI images can use a grayscale gradient or other simple gradient that everybody can discern, but then nobody could get the full impact of the images. For now, I am going to continue using both red and green, and my new colormap is below.
.

The new colormap I have been using for NDVI images (above) and how it appears to protanopes (lower). It's not very useful to protanopes.
.
This new colormap has several useful features (for about 90% of us).
- The left half of the colormap has three gradients between black and white. This does not allow you to discern the value from the tone, but the values of NDVI below zero indicate zero photosynthesis, so we generally do not care exactly what the value is. The multiple gradients preserve the detail of non-plants in the NDVI image. It just makes the NDVI image easier to look at because you can recognize objects and textures that are not foliage.
- The boundary between grayscale and color is not at zero. Live foliage generally does not have NDVI values below 0.1, so that is the boundary between grayscale and color. With this colormap, anything in grayscale is probably not a plant. This allows a more precise differentiation between plant and non-plant when the NDVI values are calibrated.
- There is a narrow band of violet between 0.1 and 0.2 which could represent very low photosynthetic activity, but might also be noise or error.
- The primary gradient of photosynthetic activity is from NDVI values from 0.2 to 0.9, and that is represented with a classic heat map from green to yellow to red. It's a little bit counter intuitive because green does not represent the healthiest plants, but the heat map metaphor seems to work well for most people.
- The highest values (> 0.9) are colored magenta. Foliage generally does not have NDVI values this high, so this color represents non-plants. I did not make it a gray so it can be distinguished from low values. In many cases, DIY NDVI values above 0.9 are artifacts where the image is very dark or very bright. .

A legend for the new colormap.
.
Below are some NDVI images colored with the new colormap. I have included the original photo, either normal color or Wratten 25A super-red Infragram. If a normal color photo is included, the NDVI image was derived from a two-camera system. In some cases a constant was added to the NDVI values of all the pixels to shift them to a more meaningful range. In other words, these NDVI images are not calibrated except by brute force. The NDVI images were made with the Photo-monitoring plugin for Fiji.


Middlebury College Organic Farm
.


Middlebury College Organic Farm taken by Teddy with an S100
.


Cover crop trials
.


Lichens and moss
.


Backyard from a Mobius Infragram on a pole
.
I will make this new color map available as a lut file for use in Fiji when I figure out how to add binary files to research notes or wikis.
[UPDATE]
.
You can download the new colormap here:
This should be copied to the C:\Program Files (x86)\Fiji\Fiji.app\luts directory or something like that on Windows, and I guess to .../Applications/Fiji.app/luts on Mac. I will have to ask Ned to include this in the package at Github.
29 Comments
The colour ranges of retinal cones are: Blue-Yellow Red-Green Light-Dark
In photography: The subtractive colour spectrum (start by calibrating White-balance) gives red, green, blue. The additive colour spectrum (start by calibrating Black-balance) gives cyan, yellow, magenta.
This is what it looks like when missing with overlapping filters:
This is how software helps you adjust those balances in RGB & CYM:
I hope this helps you find a spectrum of relevance to you. :)
Reply to this comment...
Log in to comment
Greetings, Just post the CSV file for the gradient. It is easy enough to create the LUT file.
Reply to this comment...
Log in to comment
Here is a tab delimited file of the new lut:
NDVI_VGYRM-lut.txt
Will Fiji make a lut file from this?
Is this a question? Click here to post it to the Questions page.
Reply to this comment...
Log in to comment
Actually, Fiji needs as CSV file to work on. So, I copied and pasted your text file into EXCEL and deleted the top line. Each column in your text file needs to be in a separate column in the excel file. So, saved as a csv file and then used the LUT IMPORT plugin to bring the csv file up then used IMAGE>COLOR>EDIT LUT to save the LUT file. You can also invert the gradient and save the invert too - which I did. I have tried attaching the files but for some reason they don't want to upload. If you have trouble creating your own LUT files, send me your e-mail to mine as aswicks@gmail.com I will send them to you.
Reply to this comment...
Log in to comment
Great colormap! I am using MATLAB to calculate and create images based on the Infragram Point and Shoot (modified Mobius). When I compare my images to those generated using the "Fastie" colormap on the infragram.org page, I noticed that there is a small but subtle difference. Attached are two images comparing the website:
and my MATLAB script:
It looks like there may be some image processing being done on the website. Are you using histogram stretching, or a modified NDVI calculation? Currently, I am just using NDVI = (B-R) / (B+R).
Thanks!
Jeff
Is this a question? Click here to post it to the Questions page.
Reply to this comment...
Log in to comment
Wow, I didn't know there was a Fastie colormap at Infragram.org. I think it will need a new name (How about VGYR for violet green yellow red?). I guess Jeff ported it to Infragram. The translation must have been done by hand so there were probably translation mismatches. But there might also be processing differences.
Your output from MATLAB looks excellent. Nice legend.
Is this a question? Click here to post it to the Questions page.
Reply to this comment...
Log in to comment
The Fastie colormap was already implemented in infragram.org, so I can't take any credit there!
What I am wondering is why there seems to be a shift in the NDVI between the MATLAB and infragram.org outputs. It looks as if the NDVI at infragram.org is a bit higher than the values which I calculated using your colormap. Hence the darker background and more green in the vegetated areas.
When calculating the NDVI, I had to convert uint8 to a double and then reclassify the images. In doing so, I tested both floor and ceiling functions, but the outputs were not shifted enough to change the output to match the infragram.org image. This is why I was wondering if the images were pre-processed with histogram stretching or normalization which may result in a bit wider range...
Jeff
Reply to this comment...
Log in to comment
I've checked the javascript from the Infragram.org site and could not see any image preprocessing from what was there, the NDVI index was calculated directly from the IR and R channel intensity values, and the colormap was fitted to a range of +1 to -1.
Still need to figure out where the shift comes from...
In the meantime, I've uploaded an animation showing the results of the Infragram point and shoot taken in a park nearby after a decent rainstorm. I will go back to photograph the same spot once the ground has dried out to see if there are any big differences in the NDVI.
https://www.youtube.com/watch?v=k8T_PpiEgxg&list=UUNp0vouv7d04EqdXvH1phgw
Is this a question? Click here to post it to the Questions page.
Reply to this comment...
Log in to comment
Jeff, It was the other Jeff (Warren) who must have added the new colormap at infragram.org. I assume some differences snuck in during the manual translation. Your video link did not work for me. Chris
Reply to this comment...
Log in to comment
Hi, I've updated the YouTube link, should work now. Contacted Jeff regarding the implementation in the Infragram.org site to see what he thinks... Jeff T
Reply to this comment...
Log in to comment
with this camera can I see how deep is ice?
Is this a question? Click here to post it to the Questions page.
Reply to this comment...
Log in to comment
I think any camera could allow you to estimate how thick ice is, if you can put the ice between the camera and the light source. The thicker the ice, the more light will be absorbed and the dimmer the light source will appear on the other side. Near infrared light behaves similarly to red light when passing through ice -- both are mostly absorbed by the ice, but NIR is absorbed more strongly.
.
The blue end of the spectrum is not absorbed as strongly, which is why ice can appear blue (only the blue wavelengths pass through). Ice and liquid water both absorb visible and near infrared light about the same amount, although imperfections in the ice can make it more opaque. The variability of those imperfections will make it difficult to use light transmission to estimate the thickness of ice because the light transmission will depend mostly on the imperfections and not the thickness. Estimating ice thickness by using a photo of the surface of the ice on a frozen body of water might be difficult, but on any water body there might be subtle cues related to thickness, especially soon after the first freezing event. Chris
Reply to this comment...
Log in to comment
Very interesting post. How can one take this a step further and analyze the % green areas that correspond to greenery? For example, the output would be to get the square footage of area that is cultivated or green.
Is this a question? Click here to post it to the Questions page.
Reply to this comment...
Log in to comment
GIS programs are really good at doing that kind of spatial analysis. If you give them the appropriate information, they can scale and correct the aerial images so they relate to a map (orthorectification). Then they can report the area of each color that is present in a given part of the image and convert that to area on the ground. Other types of image manipulation programs can report about pixel counts of different colors, but might only provide relative numbers without absolute area measurement or correction for non-vertical photos or non-flat terrain. Chris
Reply to this comment...
Log in to comment
I have updated this note to include a link to the new colormap, which is also here:
NDVI_VGYRM.lut
This should be copied to the C:\Program Files (x86)\Fiji\Fiji.app\luts directory or something like that on Windows, and I guess to .../Applications/Fiji.app/luts on Mac.
Chris
Reply to this comment...
Log in to comment
how to calculate the chlorophyll content in terms of NDVI?
Is this a question? Click here to post it to the Questions page.
Reply to this comment...
Log in to comment
Hi jtuhtan. You can get a MATLAB script? Thanks!
Is this a question? Click here to post it to the Questions page.
Reply to this comment...
Log in to comment
Id like to use the alternating white/black/white/cyan/green/yellow/red/magenta gradient, Im using GIMP 2, and Im wondering how to do it? Ive just joined this forum, and found it really useful.
Ive also got 2 mobius cams, one infrablue, the other RGB. Id like more useful color data, i just dont know how to do it. can you help?
Thank you Patrick
Is this a question? Click here to post it to the Questions page.
Reply to this comment...
Log in to comment
Hi Patrick,
To do this in GIMP you will need to work with indexed images and upload a GIMP palette file (.gpl) which follows the Fastie colormap.
My advice would be up upload Chris' NDVI_VGYRM.lut file and then using a text editor, compare it to the .gpl file to see how you can convert the files from one format to another. Once you have loaded the new .gpl then you can try it on your mobius imagery.
Jeff
Reply to this comment...
Log in to comment
Thank you for a quick response jtuhtan.
I have the NDVI_VGYRM.lut, but have know idea how to use a .gpl file. Ive seen this: https://www.youtube.com/watch?v=-nNnWEHNO_w Im trying to get this done for a class in the next 2 weeks. This remote sensing just has so much potential.
-Patrick
Is this a question? Click here to post it to the Questions page.
Reply to this comment...
Log in to comment
you can find my posts here: http://publiclab.org/notes/PatrickC/11-13-2014/binocular-mobius-tripod-for-nvdi any help is appreaciated.
Reply to this comment...
Log in to comment
I still cant get the .lux file to work, and i need to get this working for class. is there a explanation to use the .gpl type files?
TY, -Patrick
Is this a question? Click here to post it to the Questions page.
Reply to this comment...
Log in to comment
Jeff (Jtuhtan) could you please direct me to the right place so I can create a legend with values on my NDVI photos...
Thank You
David
Reply to this comment...
Log in to comment
Hi David,
The code I used was MATLAB, overlaying an image of the Fastie colormap onto the NDVI image. What software are you working with?
Is this a question? Click here to post it to the Questions page.
Reply to this comment...
Log in to comment
I use Fiji with the photomonitoring plugin...I would like to create a legend with the values, what would be AWSOME is to have the values on the image as well, not sure if this is possible.
To be honest I'm new to all this and I'm not real sure what the difference in Fastie, stretched and normal processing do.
I currently have a drone with a NDVI-7, an NDVI lens created by IR pro, camera on it.
Reply to this comment...
Log in to comment
Hey jtuhtan ! I'm trying to create a colormap like yours in matlab, but cannot figure it out how to change half of the color range (from -1 to 0) in gray and the rest in RGB. Is it possible to share your matlab script? It will help my visualize better my NDVI image. Thank you in advance! Keep up with the great work!
Is this a question? Click here to post it to the Questions page.
Reply to this comment...
Log in to comment
Hello @cfastie ,
It's a good post, you have good photos. I'm new in photo monitoring. I have a question which camera do you use to take this imagens and in wich format (.jpg, .png, ....)? You only use Wratten 25A filter?
Is this a question? Click here to post it to the Questions page.
Reply to this comment...
Log in to comment
A few different cameras were used to take those photos. Most of the cameras were Canon PowerShots. I think all of the photos were saved by the camera as jpegs. Some of the NDVI images were made from photos taken with a camera modified with a Wratten 25 filter. Some were made with a two camera system (see text).
Chris
Reply to this comment...
Log in to comment
Login to comment.