Spectrometry Blog
[](/i/47353?s=o)
Not sure why I see nothing in this. Where did I go wrong ?
Follow related tags:
spectrometer spectrometry
First Attempt Bombed... But Why ?
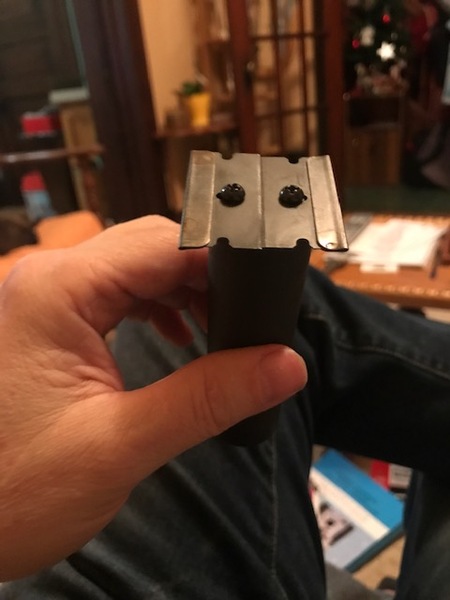
Well I used my 3D printer, machine shop and tried to make an approximation of the device suggested here and I get absolutely nothing.
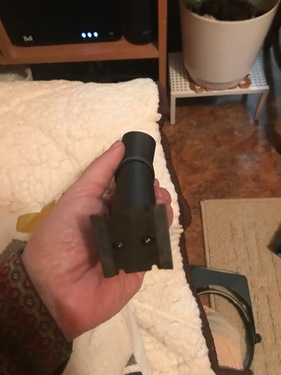
As you can see, I blackened two utility blades and mounted them on top of a 10 mm hole in the distal end. The slit is 0.1 mm wide and of course 10 mm long. I'm not sure if you can see it, but I mounted my DVD grating on a plane, angled 60 degrees to that end cap with the slit. I then made a tube that, at it's midpoint takes a 45 degree turn to the ocular end, i did not target any particular lengths in either tube as i only caught some of those suggested measurements after printing this out. I certainly can trim either tube. I twisted the one tube on the other a full 360 degrees. I am not at all clear on what was meant in the instructions about the grating lining up with the slit or what we are supposed to notice when it does. i cannot remember now which way my grate lines go but as i said, the design allows me to rotate a full circle.
Anyhow, looking in that short 45 degree eye piece end, I don't see anything but my dvd plastic , when I point the slit at a light. The grating is functional, I can see a reflected spectrum when the light, incoming from my face end catches the grating. Not sure what I'm doing wrong but appreciate some critiques or suggestions.
Follow related tags:
spectrometer spectrometry first-time-poster
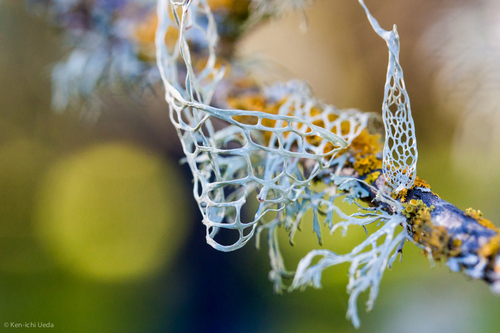
Research Paper: Correlating NDVI with Lichen Responses to Air Pollution
Cover Image: Photo by Ken-ichi Ueda, Flickr, CC BY-NC 2.0
A 2001 paper titled "Photosynthesis, Chlorophyll Integrity, and Spectral Reflectance in Lichens Exposed to Air Pollution" identifies the relationship between elemental concentrations in Ramalina lacera lichen (pollutants the lichen has absorbed from the air), and how well the lichen performs photosynthesis. This study is interesting because it is one of few studies that examines spectral reflectance (what wavelengths a specimen reflects) in lichen bioindicators, and it can serve as a "proof-of-concept" for a method that can be implemented with community science tools. More specifically, this method would involve using near-infrared camera or a spectrometer to calculate the normalized difference vegetation index (NDVI), a measure of vegetation health, of lichen specimens, which could then be transformed into information about pollutants in the air.
This note summarizes the methods and results from this study and offers ideas for modification for a community science application.
METHODS
The study determined elemental concentration of lichen via inductively coupled plasma atomic emission spectrometry (ICP--AES), which is a common approach for lichen elemental analysis.
The study also measured various indicators of photosynthetic ability, including the following:
- Chlorophyll content: Measured after extraction with a solvent
- Integrity of chlorophyll: Chlorophyll 'a' and phaeophytin 'a' concentrations were determined with a spectrophotometer , and the ratio is a proxy for chlorophyll integrity because phaeophytin can interfere with photosynthesis. Read more here
- Chlorophyll Fluorescence: Chlorophyll fluorescence---a practical guide has a good overview of how this analysis works, but fundamentally, the more fluorescence (emitted light), the lower the ability of the lichen to photosynthesize. This is measured with a fluorometer.
- Net Photosynthetic Rate: CO2 exchange rate of the lichen is measured with a infrared gas analyzer.
- Spectral Reflectance and NDVI: The average reflectance of the lichen in the near infrared (NIR) range, wavelengths between 800-1000nm, with a Li-Cor LI 1800 field spectrometer.
RESULTS
The study found a positive correlation between photosynthetic rate, chlorophyll content, NDVI, and K (potassium) content. It also found an inverse correlation between NDVI and Ba, Cr, Cu, and Ni content, which is in line with studies showing that heavy metals like Cu and Pb have detrimental impacts on lichen health and photosynthetic ability. The following quotes from the paper summarize related, promising work comparing NDVI with elemental concentrations:


NDVI, Lichens, and Community Science
This paper and related research indicate that community science methods using NIR imaging (using a modified camera or off-the-shelf NIR camera) and/or spectrometry with lichen to calculate NDVI can be a viable proxy for relative air pollutant concentration. Possible methods include:
- Comparing NDVI for the same species of lichen sampled in various locations to air monitor data to develop a response curve for pollutants of interest, then use the response curve to estimate level of pollutants for lichen sampled in areas without a reference monitor.
- Comparing compare the NDVI of lichen sampled in a "clean" air area with that of lichen sampled near polluted areas to determine the relative severity of the pollution.
Note that NDVI analysis will not provide measurements of pollutants in the air, rather, it is most useful to compare relative lichen health within a geographic region with similar weather, rain, and sun conditions. Care should be taken to minimize non-air quality-related effects that would impact the NDVI, including, but not limited to, differences in lichen species, temperature, precipitation, and insolation. Additional research quantifying the impact of these and other non pollution-related parameters is needed to adjust for these effects and draw out only the pollution-related effects on relative NDVI.
Garty, J. & Tamir, O & Hassid, I & Eshel, Amram & Cohen, Y & Karnieli, Arnon & Orlovsky, L... (2001). Photosynthesis, Chlorophyll Integrity, and Spectral Reflectance in Lichens Exposed to Air Pollution. Journal of environmental quality. 30. 884-93. 10.2134/jeq2001.303884x.
Follow related tags:
ndvi nir spectrometry air-quality
Can I measure CSF turbidity in real time?
I'm a neurosurgery resident in Turkey. We are working on a system that will measure CSF density and content in real time.
We want to measure turbidity of the otherwise clear CSF that flows through the closed yet transparent line. So that we can see if the cell count/protein content of the fluid is increasing. Would it possible for us to modify the test chamber so that rather than a rectangular cuvette, a fluid line enters the measurement chamber and exits without interruption. We are thinking of an opaque chamber that forms an "U" so it can be dark inside for the measurement?
This is the device we're using for the CSF drainage: http://www.medtronic.me/content/dam/medtronic-com/products/neurological/critical-care/mns-duetqrg.pdf
The challenge is that we can't modify the drainage device itself, it has to get noninvasive measurements.
And would it be possible to differentiate what is causing the turbidity increase? As in, can we guess whether leukocytes or the erythrocytes increasing? And can we check if the glucose or protein levels are increasing within the CSF?
Follow related tags:
arduino spectrometry raman biohacking
Can DIY spectrometers be useful for pH determination and/or dissolved organic carbon of a water solution?
These questions have to do with certain things that I would like to achieve with DIY spectrometers. The first thing that I want to achieve is to determine the pH of a solution with purple cabbage juice. There is a research paper that tells that the pH could be accurately measured at 533 nm with absorbance values for pH values between 2 and 11, which is a wide range. I was doing some tests in the spectral workbench and noticed that for each wavelength there are 3 values, red, green and blue. Are there some ways to change these values to absorbance measurements? because, in the paper use this unit measurement.
The other thing that I would like to achieve is to determine the dissolved organic carbon (DOC) of a water sample also with a spectrometer. This is a good tool for community science because you need no reagents. The only thing that I don't know if it is possible with DIY spectrometer is to measure in the UV wavelength, because the DOC is measured at 254 nm.
I hope someone have some time to answer these questions.
Cheers!
Follow related tags:
spectrometry water-quality question:spectrometry wastewater
How to build affordable DIY Near Infra red Spectrometer for analyzing wavelength range 1000nm to 1800nm ?
I am trying to learn to build a low cost affordable near infra red spectrometer for spectral wavelengths ranging 1000nm to 1800nm . I would like to analyze and understand transmission spectrum for various materials in these wavelengths. This is for my self hobby / educational purpose . I do not have any technical background in this topic area other than school/college physics concepts :-)
Follow related tags:
spectrometer spectrometry question:spectrometer question:general