We've had some high traffic over the past few days due to coverage related to the Google annoucement about PLOTS maps, and you may have seen the website very slow or even unresponsive, especially Wednesday morning (EST). There's been a lot of interest in the story, which is great, and I wanted to both highlight some of the traffic numbers and mention what we're doing to handle them.
Visitor stats
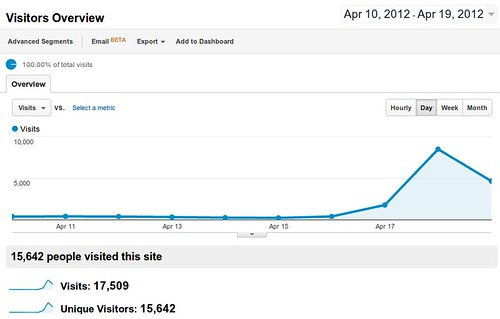
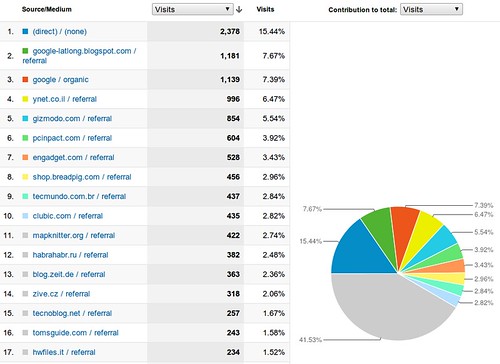
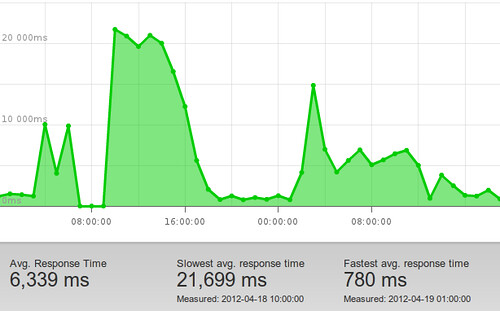
In total, over the past 3 days, we've had over 15,000 unique visitors from 143 countries. (see attached report below for how many folks from each country!) The first day we had about 1700 unique visitors, mostly directly from Google's blog post. Day two (Wednesday) I woke up at 6:30 am to a notification that the server was DOWN (thanks Pingdom). I quickly found it was just very slow, but I turned on more aggressive caching and then quickly installed the Boost module on the site, which is Drupal-based. By the end of the day we'd had over 7,000 unique visitors from a variety of other sites who'd picked up the story, including notably Engadget, Gizmodo, the Zeit blog, and more. My guess, however, is that we would've had much higher numbers if people had actually been able to load the website in less than 60 seconds (gulp).
As caching kicked in and I started moving most of the image content from our highest trafficked pages (mostly the balloon mapping page, but also the home page) onto Amazon's S3 hosting, load times dropped to 40 seconds, then 20, then 10. Whew -- within a couple hours the site was feeling almost normal! But a quick check showed that we were serving about 4-8 megabits per second, and receiving about 60-80 visitors at a time (Google Analytics). Again, this might've been higher if the site loaded faster.
Intermittent outages due to surges in traffic have resulted in >30 second load times from time to time, but by day 3 (Thursday) we were back to 2-10 seconds to load pages, despite getting on the front page of Slashdot and getting a second wave of traffic.
Actually it's easy to overlook in the fuss, but MapKnitter has also seen a large increase in use, with several new maps going up in the past couple days. Many look like balloon maps, but it's sometimes hard to tell.
Long term solutions
The caching worked well, but I think (feel free to suggest otherwise) that we're up against a hard limit by using Apache as our main webserver. I've spent some time setting up Nginx and getting ready to use it as our front line server delivering static cached content, with Apache actually generating PHP and such. You can follow this process on our Github tracker since even the PublicLaboratory.org website itself is open source.
If you're interested in following PublicLaboratory.org response times and traffic patterns, I've posted a public Pingdom page here:
http://stats.pingdom.com/o3y9jczs0nuf/359612
which you can check on to see if others are experiencing outages or slow load times.
Call for coder support
Anyhow this all highlights both the increased interest in our community's work as well as the growing need for more Drupal and web-savvy support folks to help us grow. If you're interested, you can check out our code at http://github.com/jywarren/plots, and contact the web working group at web@publiclaboratory.org.
Especially now that we've [adopted the CERN Open Hardware License as a default for newly registered users], I'm very excited to see our community grow. Keep up the great work, everyone!


0 Comments
Login to comment.