_5 Biological Dyes in Water and Isopropyl Alcohol
Author David H Haffner Sr. 08/24/2016_
Abstract
Staining is an auxiliary technique used in microscopy to enhance contrast in the microscopic image. Stains and dyes are frequently used in biology and medicine to highlight structures in biological tissues for viewing, often with the aid of different microscopes. Stains may be used to define and examine bulk tissues (highlighting, for example, muscle fibers or connective tissue), cell populations (classifying different blood cells, for instance), or organelles within individual cells.
In biochemistry it involves adding a class-specific (DNA, proteins, lipids, carbohydrates) dye to a substrate to qualify or quantify the presence of a specific compound. Staining and fluorescent tagging can serve similar purposes. Biological staining is also used to mark cells in flow cytometry, and to flag proteins or nucleic acids in gel electrophoresis.
Staining is not limited to biological materials, it can also be used to study the morphology of other materials for example the lamellar structures of semi-crystalline polymers or the domain structures of block copolymers.
The most common forms of stains are based on either being basic or acidic. These two forms attach to their opposites in tissues. So basic stains attach to acidic tissue structures (DNA) and the acidic stains attach to basic tissue structures (carbohydrates). Some stains (Sudan Black) specifically stain fat.
These stain different parts of cells purple or pink. If you are studying bacteria, the first stain method is the Gram stain. There are certain bacteria types that will stain with this material (gram positive) and some that will not (gram negative). There are now stains that will attach to almost every unique structure in a cell and make things more visible under a microscope.
Introduction
A variety of environmental factors affect fluorescence emission, including interactions between the fluorophore and surrounding solvent molecules (dictated by solvent polarity), other dissolved inorganic and organic compounds, temperature, pH, and the localized concentration of the fluorescent species. The effects of these parameters vary widely from one fluorophore to another, but the absorption and emission spectra, as well as quantum yields, can be heavily influenced by environmental variables. In fact, the high degree of sensitivity in fluorescence is primarily due to interactions that occur in the local environment during the excited state lifetime.
The purpose of this study was because I began to notice that some of my samples would not fluoresce under certain conditions i.e., Rhodamine B in ethanol will fluoresce brightly in a dilute solution of only 100ppm or 100ppb, where in this study (solvent used was 90% distilled water in 10% Isopropyl alcohol,) I still used 2 drops of rhodamine b, but I had to use the stock solution of 20% to get fluorescence. Carbol fuchsin did not fluoresce because of its weak interaction with this particular buffer solution but does have a recorded emission of 630nm. Fast green has weak fluoresce because it is a triarylmethane, which is similar in part to Malachite green, an arylmethine dye. So samples 2, 4 and 5 are included with their respective emission plots, with samples 1 and 3 included in the absorption data.
This study can be an important blueprint in understanding not only these particular molecular interactions between solvent and solute, but in other areas of interest also, case in point, is with Public lab’s DIY oil testing kit, understanding sample collection procedures is only part of the full equation. Knowing what to do with that sample is the most critical aspect in the final phase of evidence collection. Understand the various solvents that you are going to work with i.e., knowing that Isopropyl alcohol is a polar solvent, so it would not be advisable to use it as a dissolving agent for processing an oil sample (either in liquid or solid form,) neither is mineral oil (you are just emulsifying one petroleum product into another.)
The reason being is; oil is an aromatic hydrocarbon (non-polar.) Think of polar and non-polar as a positive or negative charge. Example; let’s say I want to extract Beta-carotene from Chlorophyll, I would have to know what polarity that the B-carotene molecule is, which is non-polar (because it is an aromatic hydrocarbon,) I could use a solvent like ethyl acetate, which is non-polar but ideally I would use acetone because it has the best of both worlds, polar and non-polar properties that will cause significant separation of chlorophyll A and B from the B-carotene (the B-carotene is a heavier molecule and will remain closer to the bottom of the separation) container and the chlorophyll will move farther away because of opposite polarities.
I know this also, because I have conducted this experiment several times. The point is to understand the fundamentals of what you are working with and trying to do or accomplish.
I also wanted to understand why some solvents cause some substances to shift farther to the red end of the spectrum, as is the case here with Rhodamine B and Safranin O, but not Eosin Y.
Here is the mechanism for that change in molecular state between solvent and solute;

After the fluorosphore has been excited to higher vibrational levels of the first excited singlet state (S(1)), excess vibrational energy is rapidly lost to surrounding solvent molecules as the fluorophore slowly relaxes to the lowest vibrational energy level (occurring in the picosecond time scale). Solvent molecules assist in stabilizing and further lowering the energy level of the excited state by re-orienting (termed solvent relaxation) around the excited fluorophore in a slower process that requires between 10 and 100 picoseconds. This has the effect of reducing the energy separation between the ground and excited states, which results in a red shift (to longer wavelengths) of the fluorescence emission. Increasing the solvent polarity produces a correspondingly larger reduction in the energy level of the excited state, while decreasing the solvent polarity reduces the solvent effect on the excited state energy level. The polarity of the fluorophore also determines the sensitivity of the excited state to solvent effects. Polar and charged fluorophores exhibit a far stronger effect than non-polar fluorophores.
Materials and Methods
All 5 dyes were available commercially form Amazon.com and Consolidated Chemical. Distilled water (TDS of 0) and Isopropyl alcohol were used as the solvent, 90 percent distilled water mixed in 10 percent Isopropyl alcohol (99.99% purity Lab grade standard.) Using 5 13X100mm glass test tubes with screw tops, from Karter scientific (402D2,) each test tube was labeled as AB10-S [1] thru [6] Batch#04. Drop volume was weighed on a lab quality digital scale (GEM50-Smart scale) 2 drops per sample was transferred to each test tube.
After sample concentration amounts were transferred to the appropriate test tube, each was filled with solvent in quantity of: 10ml and lightly shaken and screw tops put on. Using a plastic disposable pipette, 2.1ml was transferred to each appropriate cuvette and capped.
Instrumentation
Absorption and emission spectra was acquired with the DH 4.0 v4 spectrometer using a 0.11mm slit width and a spectral bandwidth of 1.6nm Emission spectra was acquired using a DPSS 532nm Green laser (150mW) using a perpendicular(90deg) angle. Wavelength range for emission and absorption measurements were; (353nm – 800nm.) Spekwin32 v1.72.2P6 was the software used to process both absorption and emission spectra.
*Absorption spectra was acquired using a Solux 4700K 12vdc tungsten filament lamp (using forward facing geometry.) 5 sample cuvettes were used, plastic UV disposable (240nm - 800nm) and 1 for the Blank (Solvent-H2O+C3H8O.)
Absorption and Emission Measurements
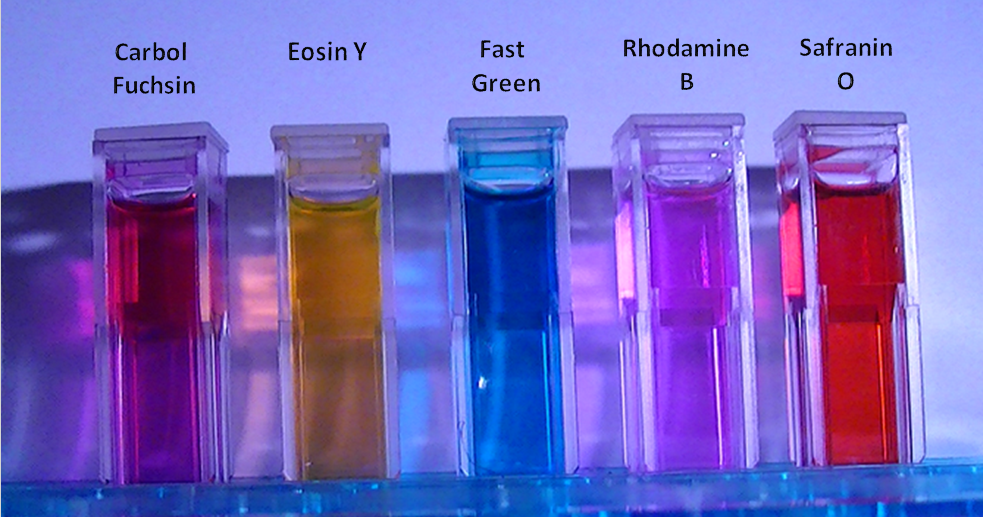
 Fig.1(a) From left to right, carbol fuchsin, eosin y, fast green, rhodamine b and safranin O.
Emission wavelengths were determined using absorption data from this chart, then final wavelength was chosen after actual absorption spectra was processed.

Table 1.
A control group in a scientific experiment is a group separated from the rest of the experiment where the independent variable being tested cannot influence the results. This isolates the independent variable's effects on the experiment and can help rule out alternate explanations of the experimental results. In this experiment my control group is the solvent compound, since it is neutral with negative absorption and covers my wavelength range.

Next are the emission spectra for Eosin Y, Rhodamine B and Safranin O. Wavelength range chosen was 500nm – 800nm according to absorption data acquired earlier. Figure 1 is the raw data and figure 2 is the spectral data after processing.


Absorption spectra sample 2 fig 5 (529.38nm,) sample 4 fig 7 (560.79nm) and sample 5 fig 8 (530.72nm) all are within the predicted absorption range from table 1. Sample 1 fig 4 (537.45nm) and sample 3 fig 6 (568.87nm) are within range also.


Results and discussion
 Table 2. Absorption and transmission data, plus percentages for all 5 samples
 Table 3. Pictured are the 5 dyes that I used in this research study
 Fig. 9 Colum representation of the Molar Coefficients and concentration levels of all 5 samples
Figures 10 and 11, are included here as examples for a most interesting substance, Rhodamine b. Figure 10 is Rhodamine b in water, with its corresponding absorption spectrum at 554nm and emission at 576nm and figure 11 is also Rhodamine b in water (scan from Florida State University.) The significance of these two scans is, that my spectral scan of the same substance (rhodamine b in 90% water and 10% Isopropyl alcohol,) my data show an absorption of 560.79nm and emission at 593nm.
The absorption data is well within predicable ranges for the solvent used, but the red shifting for my scan I think, demonstrates a degree of protonation of water by the addition of the Isopropyl alcohol, thus increasing the red shifting of the Rhodamine b sample at that particular concentration.
 Figure.10 Original data and research article can be found in The Journal of Fluorescence and the provided link.
 Figure. 11 Rhodamine B dyed microspheres, imaged by a two-photon absorption-induced photoacoustic scanning microscope. The two-photon luminescence image is recorded simultaneously with the photoacoustic image generated by pulses from a femtosecond laser.
Conclusions
Having a solid knowledge of the interactions that occur between solvent and solute are critically important in analyzing any substance when using spectroscopy. Increasing the solvent polarity will decrease fluorescence, while decreasing solvent polarity will reduce the solvents effect on fluorescence, this is equally important to keep in mind, especially with Public Lab’s DIY oil testing kit, from my own observations and research, I recognize several flaws in their sample processing.
The number one factor is, lack of understanding in evidence processing, which needs to be followed precisely in an orderly fashion, inadequate knowledge in the chemistry of the substances your working with and their interactions between them, can lead to inaccurate or meaningless results.
Here I have worked with only one solvent, Isopropyl alcohol, and observed how only a small amount added as a catalyzing pronator to distilled water, can have a dramatic effect on sample analysis.
This is part one of a two-part series on solvents and their interactions with various substances, I will be doing the same study again using 4 separate solvents: Ethanol, Methanol, Ethyl acetate and Acetone.
References
http://micro.magnet.fsu.edu/primer/photomicrography/bwfilters.html - various biological dyes and their absorptions/table included
http://www.sigmaaldrich.com/catalog/product/sial/s2255?lang=en®ion=US – safranin O spec sheet
http://www.osapublishing.org/oe/fulltext.cfm?uri=oe-21-19-22410&id=264587 – rhodamine b in water
http://en.wikipedia.org/wiki/Staining
http://www.olympusmicro.com/primer/techniques/fluorescence/fluorotable2.html
0 Comments
Login to comment.